
You followed a signal perfectly… and it still lost.
Now you’re staring at the chart wondering: “Was the setup actually bad, or was it just normal variance?”
This is where technical analysis forex knowledge becomes your unfair advantage as a signal trader.
Not to replace signals.
But to understand them, filter them, and execute them with the right expectations.
TL;DR: The practical technical analysis signal traders should use
- Learn structure first: trend, range, and key levels matter more than any indicator.
- Use indicators as confirmation, not decisions: a clean chart + one momentum tool (RSI) + one volatility tool (ATR) is enough.
- Filter signals by location: the same entry is “A+” at support and “B-” in the middle of nowhere.
- Think in scenarios: define what must happen for TP and what invalidates the idea (SL) before you enter.
- Session timing matters: London/NY moves differently than Asia—especially on XAUUSD around $2650.
- Risk is the real edge: consistent position sizing beats “perfect” chart reading every month.
What technical analysis is (and what signal traders misunderstand)
Technical analysis is not “drawing lines until the trade works.”
It’s a framework for reading market behavior from price, volume (when available), and volatility.
As a signal follower, your goal is simpler than a full-time discretionary trader’s goal.
You don’t need 14 indicators and three monitors.
You need a small set of skills that help you answer four questions quickly:
- Where are we? (trend, range, or transition)
- What’s the key level? (support/resistance, supply/demand zone)
- Is volatility normal? (so SL/TP makes sense)
- Is timing reasonable? (session + news risk)
The biggest misunderstanding is thinking technical analysis should make you “right” all the time.
It won’t.
What it does is improve the quality of your decisions: when to take a signal, when to pass, and how to manage it.
For example, gold (XAUUSD) around $2650 can look bullish on a 5-minute chart while still being stuck under a daily resistance zone.
A signal might still work.
But your expectations should change: maybe you take partial profit earlier, or you reduce size.
That’s the difference between “I followed a signal” and “I executed a plan.”
If you’re new to following signals, keep our beginner roadmap bookmarked: forex signals Telegram guide for beginners.
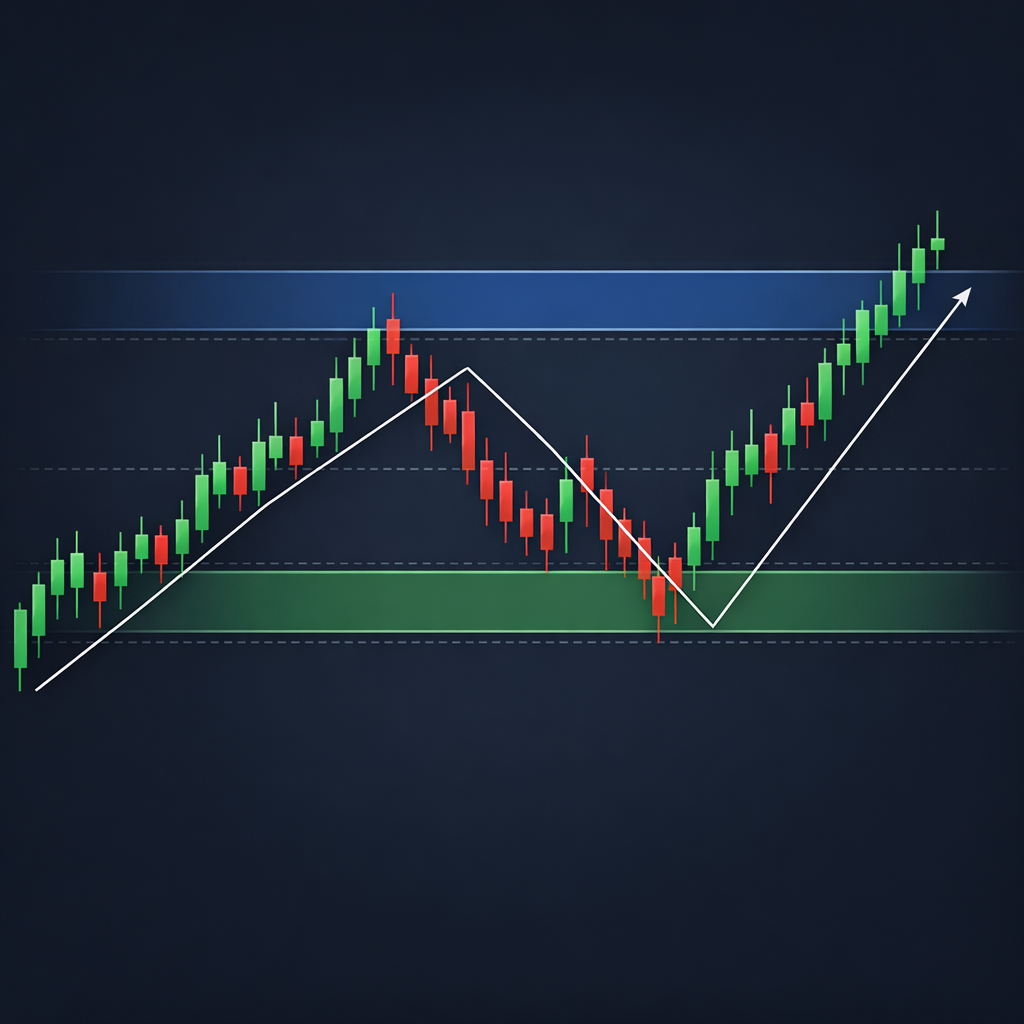
Price action basics for forex chart analysis: structure beats indicators
If you learn only one technical skill, make it market structure.
Structure is the story of swing highs and swing lows.
It tells you whether buyers are in control, sellers are in control, or nobody is in control.
Trend structure: higher highs/higher lows vs lower highs/lower lows
In an uptrend, price forms higher highs (HH) and higher lows (HL).
In a downtrend, it forms lower highs (LH) and lower lows (LL).
Signal traders often miss a key detail: trends have phases.
You’ll see impulse moves, then pullbacks, then continuation.
Most high-quality signals are placed at pullbacks into a level, not in the middle of an impulse candle.
Range structure: the “trap zone” for signal followers
Ranges are where many traders get chopped.
Price bounces between a clear top and bottom, and mid-range entries are statistically weaker.
Let’s use realistic current context:
- XAUUSD is around $2650 (+0.35% in 24h).
- Imagine gold is ranging between $2618 support and $2685 resistance.
A buy signal at $2622 with SL at $2607 (15 points risk) is “location-based.”
A buy signal at $2651 with the same SL is “hope-based.”
Both might win.
But the first aligns with structure.
Transition structure: break of structure (BOS) and change of character (CHOCH)
You’ll hear traders say “breakout.”
More useful is: did the market break structure?
A BOS happens when price breaks the last meaningful swing high/low in the direction of a new trend.
A CHOCH happens when the market stops making HH/HL and starts making LH/LL (or vice versa).
As a signal trader, you don’t need to label every swing.
You just need to recognize when a signal is fighting a fresh structural shift.
If EUR/USD is at 1.0520 and just broke below a weekly swing low, you treat buy signals as lower confidence until structure improves.
Support, resistance, and “signal location”: the filter that saves accounts
Most losing months for signal followers come from one problem: taking too many trades in bad locations.
Support and resistance sounds basic, but doing it correctly is a professional skill.
We’re not looking for a single perfect line.
We’re looking for a zone where orders repeatedly entered the market.
How to mark levels like a pro (in 5 minutes)
Here’s a simple process you can repeat daily.
- Step 1: Start on H4 or D1. Mark the last 2–3 major swing highs and lows.
- Step 2: Convert each line into a zone (a band). Use candle bodies and wicks.
- Step 3: Drop to H1. Refine the zone where reactions were strongest.
- Step 4: Drop to M15. Identify whether price is near the top, bottom, or middle of the zone.
This matters because signal quality is heavily tied to where the signal triggers.
A sell signal on USD/JPY at 149.50 is different if price is rejecting a daily resistance at 149.70 versus drifting in the middle of a range.
Gold example: turning a signal into a structured plan
Let’s say gold is printing rejections near $2680–$2685.
A sell signal arrives: Sell XAUUSD 2678, SL 2693 (15 points), TP 2648 (30 points, 1:2).
Here’s how technical analysis helps you execute:
- If price is already extended and volatility is spiking, you might wait for a retest at 2680.
- If price is calmly rejecting the zone with lower highs on M15, you can execute immediately.
- If DXY is strong at 106.80 and pushing higher, that supports downside pressure on gold.
Notice you didn’t “create your own trade.”
You validated the location and improved execution.
When to skip a signal (without overthinking)
Skipping is hard because it feels like you’re missing money.
But skipping bad location trades is how you protect your equity curve.
- Skip if entry is in the middle of a clean range.
- Skip if the trade is running into a major level within 10–15 pips on majors.
- Skip if gold is 1–2 dollars away from a strong level and your SL needs 20 dollars.
If you want a structured approach to filtering providers and setups, use our checklist: forex signals provider checklist.
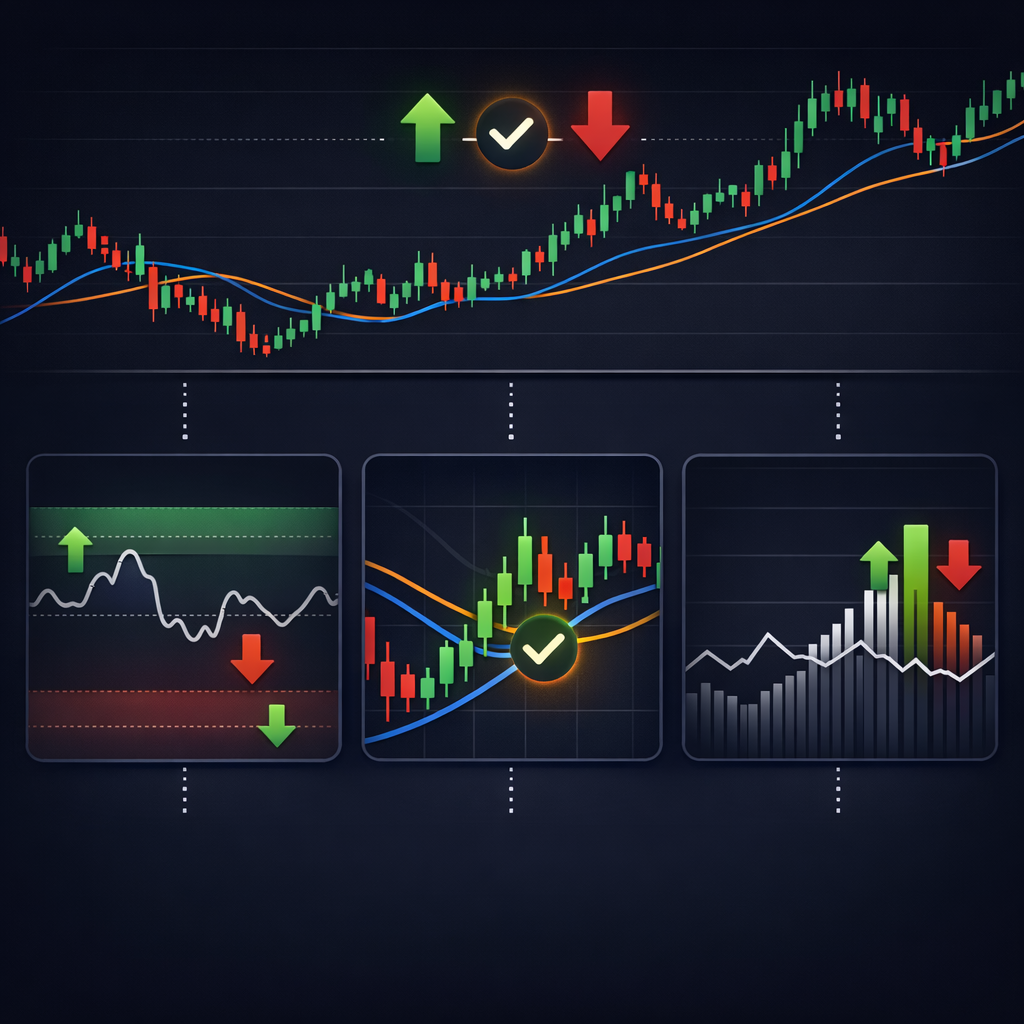
The only trading indicators most signal traders actually need
Indicators are tools.
They are not the “edge.”
For signal traders, the best indicator set is the one that prevents obvious mistakes and supports consistent decisions.
In practice, that usually means: one trend tool, one momentum tool, one volatility tool.
Moving averages (trend context, not entries)
A 50 EMA and 200 EMA can help you quickly see bias.
If price is above the 200 EMA on H1 and the 50 EMA is rising, you treat sell signals as countertrend.
Countertrend signals can still win.
But you manage expectations: smaller position, quicker partials, or tighter time stop.
RSI (momentum and divergence, not “overbought/oversold”)
Most beginners misuse RSI.
They sell because RSI is above 70 and buy because it’s below 30.
In trends, RSI can stay “overbought” for hours.
Better use:
- Momentum confirmation: in an uptrend, RSI holding above 40–50 is bullish.
- Divergence warning: price makes a higher high, RSI makes a lower high near $2685 on gold—watch for reversal.
ATR (volatility for SL and TP sanity checks)
ATR helps you understand whether your stop loss is realistic.
If XAUUSD’s M15 ATR is $2.50 and your SL is $5, you’re risking about 2 ATR.
That’s reasonable in many conditions.
If ATR jumps to $6 during NY news and your SL is still $5, you’re likely to get wicked out.
Indicator overload vs signal execution
Here’s the trap: adding indicators makes you feel safer.
But it often creates conflicting signals and hesitation.
Signal trading is execution-heavy.
The best setup is one you can check in 30 seconds: structure, level, volatility, timing.
Comparison table: price action vs indicators vs “smart money” concepts
Signal traders often ask which style they should learn.
The right answer is: learn the parts that improve filtering and execution, not the parts that turn you into a full-time analyst overnight.
| Approach | What it focuses on | Best use for signal traders | Common mistake | Time to learn basics |
|---|---|---|---|---|
| Price Action | Structure, levels, candles, trend/range | Filtering signals by location and market phase | Drawing too many lines; ignoring higher timeframe | 1–2 weeks |
| Indicators | Trend/momentum/volatility calculations | Confirming bias and checking SL/TP realism (ATR) | Using indicators as entries; analysis paralysis | 2–5 days |
| SMC / Order Flow Concepts | Liquidity, imbalances, institutional behavior | Understanding stop hunts and why levels break/hold | Overcomplicating; forcing “liquidity” narratives | 2–6 weeks |
If you’re following premium signals, price action basics give the fastest ROI.
Indicators help you avoid bad risk decisions.
SMC concepts can help you stay calm during wicks and stop runs, especially on gold.
Step-by-step: How to analyze a signal in under 90 seconds
Most people either over-analyze or don’t analyze at all.
We want a middle ground: a fast checklist that improves outcomes without delaying execution.
The 90-second signal check (use this every time)
- Step 1 (15 sec): Check H1/H4 bias. Trend or range?
- Step 2 (15 sec): Identify nearest major level (support/resistance zone).
- Step 3 (15 sec): Check distance to next obstacle (previous high/low, session high/low).
- Step 4 (15 sec): Check volatility (ATR or candle size). Is SL too tight for current conditions?
- Step 5 (15 sec): Check timing: London/NY open? Any red news in next 30–60 minutes?
- Step 6 (15 sec): Decide position size based on confidence and risk rules.
Gold scenario around $2650 (realistic execution)
Gold is at $2650, slightly up on the day.
A buy signal comes: Buy 2646, SL 2631 (15 points), TP1 2676 (30 points), TP2 2691 (45 points).
Your 90-second check might reveal:
- H4 is bullish, making higher lows.
- 2640–2647 is a prior demand zone.
- Next resistance is 2685–2690 (tight but workable).
- ATR is moderate; SL 15 points is reasonable.
So you take it.
But you plan to take partial at TP1 because 2685–2690 could reject.
EUR/USD scenario at 1.0520 (why “room to move” matters)
EUR/USD is around 1.0520.
A sell signal targets 1.0460 (60 pips).
If your chart shows a daily support at 1.0490, you now know the trade may stall after 30 pips.
You don’t need to cancel the signal.
You just manage it like a pro: partials, break-even plan, and realistic expectations.
Want signals that already include clear Entry/SL/TP and session logic?
That’s exactly how we deliver in our United Kings premium signals.
Multi-timeframe analysis for signal traders (without the confusion)
Multi-timeframe analysis sounds complex, but it’s basically one idea.
Higher timeframes define the map.
Lower timeframes define the timing.
Signal traders get into trouble when they reverse that.
They see a 5-minute pattern and ignore the daily wall right above it.
A simple 3-timeframe stack that works
- D1: major trend and major levels (the “no-go zones”)
- H1: current structure and session behavior
- M15: execution and confirmation (rejections, break/retest)
You don’t need to go lower than M15 unless your signal is a scalp.
And even then, M5 is enough.
Why higher timeframe levels matter more on gold
XAUUSD respects higher timeframe zones aggressively.
At current levels, gold can move $10–$20 in minutes during NY session bursts.
That means:
- If your TP is sitting right under a daily resistance (like $2685), take partials.
- If your SL is sitting inside a known liquidity pool (like under $2620), expect stop hunts.
Example: If price is trending up on D1 and pulls back to $2638, a buy signal there has higher odds than a buy at $2662 into resistance.
How this helps you follow signals with confidence
The real benefit is psychological.
When you know the higher timeframe context, you’re less likely to panic on normal pullbacks.
You also avoid revenge trades after a loss because you can see whether the idea was valid but unlucky.
That’s how professionals stay consistent.
Chart patterns that matter (and the ones you can ignore)
Patterns work because they reflect behavior: accumulation, distribution, breakout attempts, and failures.
But most pattern education online is too “perfect.”
Real charts are messy.
So as a signal trader, focus on patterns that are easy to identify and useful for managing trades.
High-value patterns: break and retest, double top/bottom, flags
Break and retest is the most practical pattern for signal execution.
If GBP/USD is at 1.2680 and breaks above 1.2700, a retest of 1.2700 can be a cleaner entry than chasing the breakout candle.
Double tops/bottoms are useful because they often form near major levels.
On gold, a double top near $2685 with weakening momentum often precedes a $15–$25 pullback.
Flags help you hold winners.
If XAUUSD pushes from 2648 to 2666, then consolidates in a tight $3–$4 band, that’s often continuation behavior.
Lower-value patterns for signal followers: complex harmonics
Harmonic patterns can work.
But they require precision, experience, and often subjective measurements.
For signal traders, they add complexity without improving execution much.
If a provider sends harmonics, that’s fine.
Your job is still the same: check location, volatility, and nearby obstacles.
Pattern confirmation: what to look for in candles
You don’t need to memorize candlestick names.
You need to recognize rejection and acceptance.
- Rejection: long wick into a level, close away from it (buyers/sellers defended).
- Acceptance: strong close through a level, followed by continuation.
Example: Gold wicks to $2684 and closes at $2676 on M15 twice.
That’s rejection.
A sell signal aligned with that has better context than a random sell in open space.
Volatility, sessions, and why your SL gets hit “by 1 pip”
If you’ve followed signals for a while, you’ve experienced it.
Your stop loss gets hit, then price immediately goes to TP.
This is not always manipulation.
Often, it’s volatility + liquidity behavior.
Session personality: London vs New York vs Asia
United Kings focuses heavily on London and NY session trading because that’s where volume and clean moves often appear.
- Asia: slower, more range-bound on many pairs (gold can still move, but often choppy).
- London: breakout attempts, trend continuation, strong directional bias.
- New York: follow-through or reversal, especially when US data hits.
At current conditions, with DXY around 106.80 and USD/JPY near 149.50, USD strength can create sharp risk-on/risk-off rotations.
Gold around $2650 can spike $8–$12 in minutes on headlines.
Stop placement reality: why $10–$25 matters on XAUUSD
You asked for realistic examples, so here’s what “normal” looks like.
On many intraday gold setups, a practical SL is $10–$25 from entry depending on volatility.
Example buy:
- Entry: $2642
- SL: $2627 (15 points)
- TP: $2672 (30 points, 1:2)
If gold is printing $6–$8 M15 candles, a $10 SL may be too tight.
If gold is calm and moving in $2–$3 steps, $10–$12 can be enough.
How to reduce “wick stop-outs” without changing the signal
- Use limit entries at the zone instead of market chasing.
- Wait for confirmation (rejection candle) if the signal allows flexibility.
- Reduce size and widen SL slightly when volatility is elevated.
- Avoid entries 1–3 minutes before major US data releases.
For deeper event-driven survival tactics, read: how gold signals react to unexpected news events.
Risk management for signal followers: the math that keeps you in the game
Technical analysis helps you choose better trades.
Risk management keeps you alive long enough for the edge to play out.
Most signal traders blow accounts not because signals are terrible, but because sizing is inconsistent.
Pick a fixed risk per trade (and stop negotiating with yourself)
A simple professional rule: risk 0.5% to 1% per trade.
If you’re aggressive, maybe 1.5%.
But if you’re following multiple signals per day, smaller is smarter.
Example with $2,000 account risking 1%:
- Max loss per trade = $20
- Gold SL = $15 (150 “pips” in broker terms, depending on contract)
- Your lot size is calculated so that $15 move equals $20 loss
This is boring.
It’s also how you survive 10 trades in a row without emotional damage.
Risk-to-reward: why 1:2 is a signal trader’s best friend
Many premium providers target 1:2 or 1:3 because it balances win rate and growth.
Let’s say a gold trade risks $15 and targets $30 (1:2).
Even with a 50% win rate, you can be profitable before fees and slippage.
United Kings aims for 85%+ win rate historically, but remember: past performance does not guarantee future results.
Still, pairing strong win rate with 1:2 structures creates a powerful expectancy profile.
Drawdown rules: your “circuit breaker”
Signal traders need a rule for when to stop trading and review.
- Daily rule: stop after -2R (two full stop losses).
- Weekly rule: reduce size by 50% after -4R.
- Review rule: if you break rules twice, trade demo for 1 week.
This isn’t about fear.
It’s about protecting your decision-making quality.
For a full framework, keep this open: risk management strategies when using forex signals.
How to evaluate signal quality using technical analysis (without second-guessing)
The goal is not to “judge” every signal like you’re the provider.
The goal is to spot low-quality conditions where good signals underperform.
Think of it like driving.
Even a great car performs worse in fog, ice, and heavy traffic.
Four quality filters you can apply fast
- Filter 1: Location — Is entry near a meaningful zone or in the middle?
- Filter 2: Space — Is there enough room to TP before the next level?
- Filter 3: Volatility fit — Does SL match current ATR/candle size?
- Filter 4: Session/news — Is this during London/NY flow or random chop?
Example: USD/JPY at 149.50 with DXY 106.80
When DXY is firm around 106.80, USD pairs can trend harder.
If USD/JPY is at 149.50 and your signal is a sell, ask:
- Is there a strong resistance at 149.70–150.00?
- Or is it selling into a rising trend with no ceiling?
If it’s the second case, you can still take it.
But you should treat it as a scalp, not a swing.
Example: GBP/USD at 1.2680 (clean vs messy structure)
GBP/USD can be smooth when trending and brutal when ranging.
If price is stuck between 1.2640 and 1.2720, mid-range signals will feel random.
In that environment, your best move might be to take only:
- buys near 1.2640 with tight invalidation, or
- sells near 1.2720 with clear rejection.
Technical analysis doesn’t remove losses.
It removes avoidable losses.
Execution psychology: how technical analysis keeps you disciplined
Most signal traders don’t fail because they can’t read charts.
They fail because they can’t handle uncertainty.
Technical analysis helps because it gives your brain a structure to lean on.
The three emotional mistakes signal followers make
- Chasing: entering late after price already moved (turning a good signal into a bad trade).
- Micromanaging: closing at +5 pips because you fear reversal, then watching +50 pips happen.
- Revenge trading: doubling size after a loss to “get it back.”
Charts won’t fix emotions.
But a simple technical routine reduces emotional load.
A practical routine before you place any signal trade
- Screenshot the chart (H1 + M15) and mark the key level.
- Write one sentence: “This trade works if price does X.”
- Write one sentence: “This trade is wrong if price does Y (hits SL).”
When you do this, you stop negotiating mid-trade.
You stop moving stops randomly.
You become consistent.
Why community matters (and why ours is built for execution)
Trading is lonely.
That’s why we built a community of 300K+ active traders where execution and learning happen together.
Signals are posted with clear Entry, SL, and TP levels, plus educational context.
If you want to see how this works day-to-day, join our Telegram: United Kings signals Telegram channel.
Putting it all together: a practical technical analysis toolkit for signal traders
Let’s turn everything into a simple toolkit you can actually use this week.
No theory overload.
No indicator obsession.
Your “signal trader chart template”
- Candlesticks
- Support/resistance zones (from D1/H4)
- 50 EMA and 200 EMA (optional but helpful)
- RSI (14) for momentum context
- ATR (14) for volatility checks
That’s it.
Your weekly learning plan (30 minutes/day)
- Monday: Mark weekly levels on gold and your top 2 forex pairs.
- Tuesday: Review 5 winning signals and identify what they had in common.
- Wednesday: Review 5 losing signals and identify the “filter” you ignored.
- Thursday: Practice the 90-second signal check on historical charts.
- Friday: Build a one-page rule set (risk, sessions, when to skip).
If you do this for 4 weeks, your signal execution will look completely different.
Where United Kings fits (signals + education, not one or the other)
Some providers send entries and disappear.
We do both: premium signals and education, because long-term performance depends on the trader too.
Explore our dedicated pages based on what you trade:
- Gold (XAUUSD) signals for London/NY session setups
- Forex signals for majors and high-liquidity pairs
- Crypto signals if you diversify beyond FX and metals
If you want to compare our approach with other options, see: best forex signals (November 2025) review.
FAQ: Technical analysis for signal traders
Do I need technical analysis if I’m using a signal provider?
You don’t need it to place trades, but you need it to filter, time, and manage risk like a professional.
Even basic structure + key levels can significantly reduce low-quality entries.
Which timeframe is best for forex chart analysis when following signals?
Use D1/H4 for key levels, H1 for context, and M15 for execution.
If the signal is a scalp, add M5 for timing, but don’t ignore H1/H4.
What are the best trading indicators for beginners following signals?
A clean set is: 50 EMA/200 EMA for trend context, RSI for momentum, and ATR for volatility.
Avoid stacking multiple oscillators that tell you the same thing.
How do I know when to skip a signal?
Skip when entry is mid-range, when there’s no “space” to TP, when volatility makes the SL unrealistic, or when major news is imminent.
Skipping is a skill, not a weakness.
Can technical analysis help with gold (XAUUSD) signals specifically?
Yes—especially with zones, session timing, and volatility.
Gold around $2650 can move fast; understanding where liquidity sits (above highs/below lows) helps you avoid emotional exits.
Risk disclaimer
Trading forex, gold (XAUUSD), and crypto involves significant risk and is not suitable for every investor. You can lose some or all of your capital. Signals and analysis are provided for educational and informational purposes and do not constitute financial advice. Past performance is not indicative of future results. If you’re a beginner, consider practicing on a demo account before trading live, and always use proper risk management.
Join United Kings: premium signals + the education to execute them
If you want signals you can follow with clarity—Entry, Stop Loss, Take Profit, and session logic—United Kings is built for you.
We deliver premium Telegram signals for forex and gold, with an active community of 300K+ traders and a performance-driven approach focused on London and New York sessions.
Choose the plan that fits your goals on our pricing page:
- Starter: 3 Months for $299 (~$100/mo)
- Best Value: 1 Year for $599 (~$50/mo) + FREE ebook
- Unlimited: Lifetime for $499 (pay once, access forever)
Ready to trade with structure instead of hope?
Join our Telegram now and start receiving premium setups today: United Kings premium signals on Telegram.
