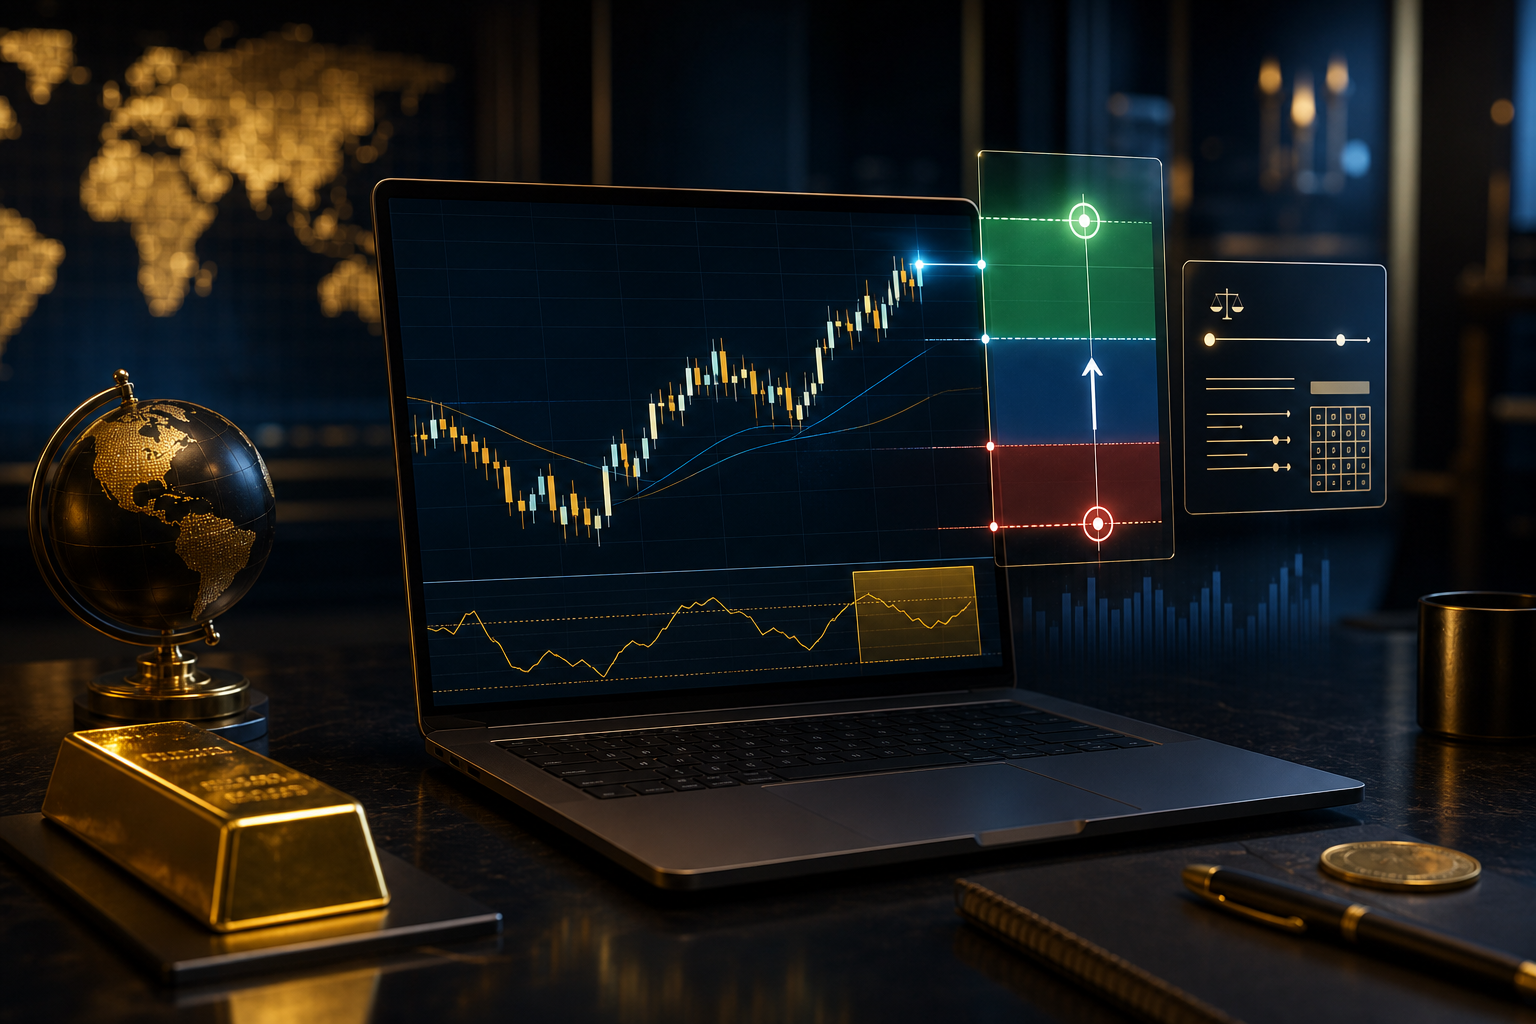
You’re about to follow a forex or XAUUSD signal… but do you actually know how it performs in your hands?
Not in someone else’s screenshot.
Not in a “results” highlight reel.
In your TradingView chart, with your spreads, your session availability, and your discipline.
In this guide, we’ll show you exactly how to backtest forex signals and backtest XAUUSD signals in TradingView using Bar Replay, a rule-based execution checklist, and a simple journal workflow. We’ll measure what matters: win rate, average R:R, expectancy, drawdown, and filters (London/NY sessions + news).
We’ll use realistic current levels: XAUUSD ~$2650 (+0.35% 24h), EUR/USD 1.0520, GBP/USD 1.2680, USD/JPY 149.50, and DXY 106.80.
TL;DR — The Backtesting Workflow (Do This First)
- Pick a signal style (scalp/day/swing) and define rules for entry, SL, TP, and invalidation before you replay a single candle.
- Use TradingView Bar Replay to simulate “live” decision-making and avoid hindsight bias.
- Journal every trade in R-multiples (e.g., +2R, -1R) so gold and forex trades are comparable.
- Measure expectancy (not just win rate): Expectancy = (Win% × Avg Win R) − (Loss% × Avg Loss R).
- Add filters gradually (London/NY session, spread/volatility, red-news windows) and see if they improve drawdown without killing opportunity.
- Decide how to act on future signals: follow, skip, or size down based on your tested stats and your risk limits.
Why Backtesting Signals Is Non-Negotiable (Especially for XAUUSD)
Signals can be excellent and still fail for you.
That’s not a contradiction. It’s execution reality.
Gold at $2650 doesn’t behave like EUR/USD at 1.0520. XAUUSD can move $8–$15 in minutes during active sessions, and it can spike even harder around CPI, NFP, or surprise headlines.
When DXY is elevated around 106.80 and USD/JPY is near 149.50, the market is often sensitive to yield moves and risk sentiment. That sensitivity shows up in gold as fast stop runs, liquidity sweeps, and wick-heavy candles.
So if you copy a signal without testing, you’re not really trading a strategy. You’re trading hope.
Backtesting fixes that by answering practical questions:
- Do signals perform better in London and NY sessions than Asia?
- Does XAUUSD need a wider stop (e.g., $15–$25) than EUR/USD (e.g., 10–25 pips) for the same setup?
- Are you taking profits too early and killing the edge?
- Are you getting slipped or stopped because you enter on the wrong candle?
- Does avoiding red news improve drawdown, or does it remove the best moves?
Backtesting also protects you from a common trap: high win rate, low payoff. A system can win 70% of the time and still lose money if the average win is small and the average loss is large.
That’s why we’ll focus on R-multiples and expectancy. It’s the cleanest way to compare XAUUSD and forex signals in one journal.
If you’re new to signal evaluation, also keep a checklist handy. Our guide on how to evaluate a signal provider with a practical checklist pairs perfectly with this backtesting workflow.
What You Can (and Can’t) Backtest with TradingView Bar Replay
TradingView Bar Replay is powerful, but you need to respect what it actually simulates.
It’s best at testing decision logic: entries, exits, invalidations, timing, and whether you follow rules under uncertainty.
It’s weaker at simulating real execution: spreads widening, slippage, partial fills, and broker-specific pricing quirks.
That’s not a deal-breaker. It just means you should backtest in two layers:
- Layer 1: Chart-edge test (Bar Replay). Proves the setup logic and timing.
- Layer 2: Execution sanity check (demo forward test). Proves you can execute with spreads and emotions.
Here’s a practical comparison so you choose the right tool for the job.
| Method | Best For | Weakness | When to Use |
|---|---|---|---|
| TradingView Bar Replay | Testing entries/exits, timing, session filters, rule discipline | No true slippage/spread simulation; can still “cheat” if you peek | First pass on any forex/XAUUSD signal style |
| Strategy Tester (Pine strategy) | Large sample size, quick stats, systematic rules | Hard to encode discretionary rules; may overfit | When your rules are mechanical enough to code |
| Demo forward testing | Real spreads, emotions, execution speed, news spikes | Slow; small sample size early on | After Bar Replay proves the logic is viable |
| Live micro risk | Final validation of psychology + execution | Real money risk; mistakes cost | Only after consistent demo results |
For most traders following signals, Bar Replay is the sweet spot because it forces you to make decisions candle-by-candle. That’s exactly how you’ll experience a Telegram signal in real time.
And if you’re using a premium provider like United Kings, where signals come with Entry, SL, and TP levels, Bar Replay lets you test a crucial question: Do you execute the signal the same way it was designed?
If you want to understand what professional execution looks like in practice, read our trading blog alongside this guide and build your own repeatable workflow.
Define Your “Signal Rules” Before You Replay Anything (The Anti-Curve-Fit Step)
The biggest backtesting mistake isn’t bad math.
It’s changing rules mid-test until the results look good.
Before you use a single replay candle, write down the exact rules you will follow when a signal arrives. If you follow United Kings signals, this is straightforward because the signal structure is clear: Entry, Stop Loss, Take Profit(s).
But you still need personal rules for how you execute.
Rule Set #1: Entry Execution
- Market vs limit: Will you enter at market when price touches the entry zone, or only with a limit order?
- Confirmation: Do you require a candle close above/below a level, or do you enter on touch?
- Timing: Will you take signals only during London and NY sessions?
Example for XAUUSD near current levels: price is around $2650. A buy signal might be “Buy 2642–2645, SL 2630, TP 2669.”
Your rule must specify: “Enter at 2644 on touch” or “Enter only if a 5-minute candle closes back above 2645 after a sweep.” Those are different strategies.
Rule Set #2: Stop Loss Discipline
- Hard SL only: You never widen the stop.
- One adjustment rule: If spread spikes, you allow a fixed buffer (e.g., +$2 on gold), but only once.
For gold, a typical SL distance is $10–$25 depending on timeframe and volatility. If your average is $12 but you keep widening to $25, you will destroy your R:R.
Rule Set #3: Take Profit Logic
- Fixed R target: Always take 2R or 3R.
- Scale-out: Take partial at 1R, move SL to BE, then target 2R+.
- Structure-based exit: Exit at prior high/low or liquidity pool.
Example: If XAUUSD buy entry is 2645 and SL is 2633, risk is $12. A 2R target is 2669 (2645 + 24). A 3R target is 2681 (2645 + 36).
Write your exit rule now. Don’t invent it later.
Rule Set #4: “Skip Conditions” (Your Filters)
- Skip within 10 minutes before and 10 minutes after major red news (CPI, NFP, FOMC).
- Skip if spread is abnormal (you’ll define what “abnormal” means in your broker).
- Skip if price is already 70% to TP when you see the signal (late entry rule).
This is where many signal followers level up. You’re not rejecting signals emotionally. You’re applying tested filters.
For more on sizing and protecting capital while following signals, keep our guide bookmarked: risk management strategies when using forex signals.
TradingView Setup for Backtesting Forex & XAUUSD Signals (Clean, Fast, Repeatable)
Your TradingView chart should feel like a cockpit: minimal clutter, maximum clarity.
Backtesting is slow when your chart is messy.
Here’s a setup that works for both forex pairs and XAUUSD.
Step 1: Choose the Right Symbol and Session
- XAUUSD (spot gold) for gold signals.
- EURUSD, GBPUSD, USDJPY for major FX signals.
Given current context (EUR/USD 1.0520, GBP/USD 1.2680, USD/JPY 149.50), majors may be sensitive to USD strength with DXY near 106.80. That matters when you interpret breakouts and pullbacks.
Step 2: Pick Two Timeframes (Execution + Context)
- Context timeframe: 1H or 4H to see trend, key levels, and where liquidity likely sits.
- Execution timeframe: 5m or 15m to execute entries and manage trades.
For XAUUSD, 5m can be noisy during NY open. If you find yourself getting chopped, test 15m execution.
Step 3: Add Only the Tools You’ll Actually Use
- Session shading: London and New York.
- Daily/weekly levels: previous day high/low, weekly high/low.
- ATR (optional): to flag abnormal volatility days.
Avoid adding five oscillators “just to confirm.” If your signals are price-action based, your backtest should be too.
Step 4: Define Your “Replay Template” Layout
- One chart with execution timeframe.
- One chart with higher timeframe context.
- Watchlist with XAUUSD + 3–5 pairs you trade.
Save it as a TradingView layout. Backtesting is a volume game. Layout friction kills volume.
Step 5: Create a Simple Markup System
- Use horizontal rays for entry/SL/TP.
- Use a rectangle to mark the entry zone.
- Use a text label for “Session” and “News proximity.”
This is how you keep your journal accurate. When you review later, you’ll remember why you entered.
If you’re actively following signals, you can also compare your tested execution rules with the way our team delivers trade ideas on United Kings signals (forex + gold) so your backtest matches real-world alerts.
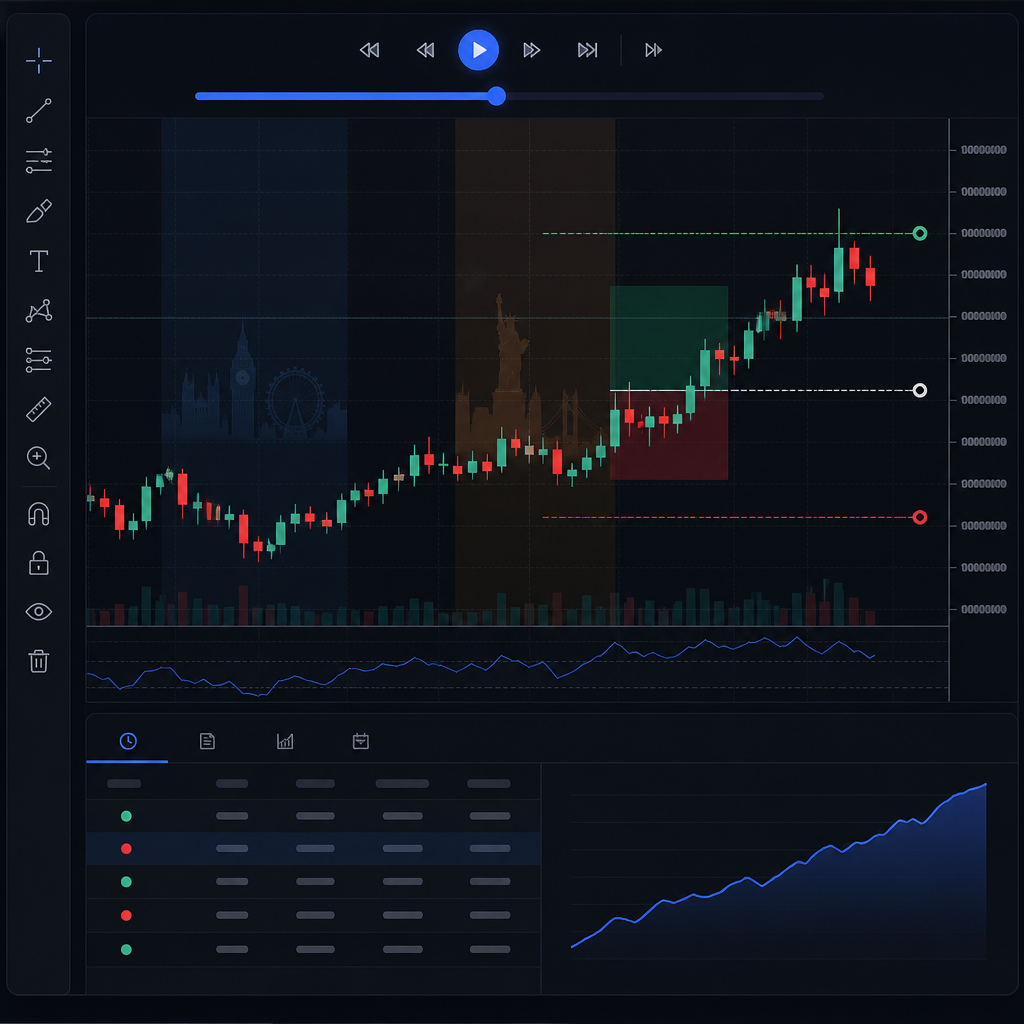
TradingView Bar Replay Strategy: Step-by-Step Backtest Process (No Hindsight)
This is the core workflow: how to use TradingView Bar Replay the right way.
Your goal is to simulate the moment a signal arrives and you must decide what to do.
Step 1: Choose a Historical Window (Sample Size Matters)
- Minimum: 50 trades for a first read.
- Better: 100–200 trades across different market conditions.
For XAUUSD, include weeks with both calm and volatile days. Gold behaves differently when it’s trending cleanly versus when it’s whipsawing around macro headlines.
Step 2: Start Replay at a “Blind” Point
- Scroll back until you can’t remember what happened next.
- Pick a date and start replay before London open.
If you already know the outcome, you’re not testing. You’re storytelling.
Step 3: Simulate Receiving a Signal
In real life, a signal might say:
- XAUUSD Buy 2642–2645
- SL 2632 (risk ~$10–$13 depending on entry)
- TP1 2665
- TP2 2675
During replay, you “receive” it when price approaches the entry zone. Now you apply your pre-written rules.
Step 4: Place Your Lines and Record the Trade Plan
- Mark entry zone.
- Mark SL and TP levels.
- Write your session context (London/NY/Asia).
Do this before the trade triggers. It prevents you from adjusting after the fact.
Step 5: Let Price Play Candle-by-Candle
- Use 1x speed for decision points.
- Pause at key candles (sweeps, breakouts, retests).
For gold around $2650, you’ll often see a sweep of a prior low (e.g., dip to 2641) then a sharp reclaim. Your rules must decide whether that’s a valid trigger or a skip.
Step 6: Manage the Trade Exactly as You Would Live
- If your plan says “move SL to BE at +1R,” do it.
- If your plan says “no partials,” don’t take partials.
This is where most backtests become fantasy. Your live self won’t behave like your backtest self unless you force consistency.
Step 7: Log the Result in R, Not Dollars
If you risked $12 on gold and made $24, that’s +2R. If you lost $12, that’s -1R.
R normalizes everything. It also exposes whether your “good month” was luck or repeatable edge.
The Journal Template: What to Track (Win Rate, R:R, Drawdown, Expectancy)
Your journal is where backtesting becomes a decision tool.
If you only count wins and losses, you’ll miss the real story.
Here’s a simple template that works for both forex and XAUUSD signals. You can run it in Google Sheets, Excel, or Notion.
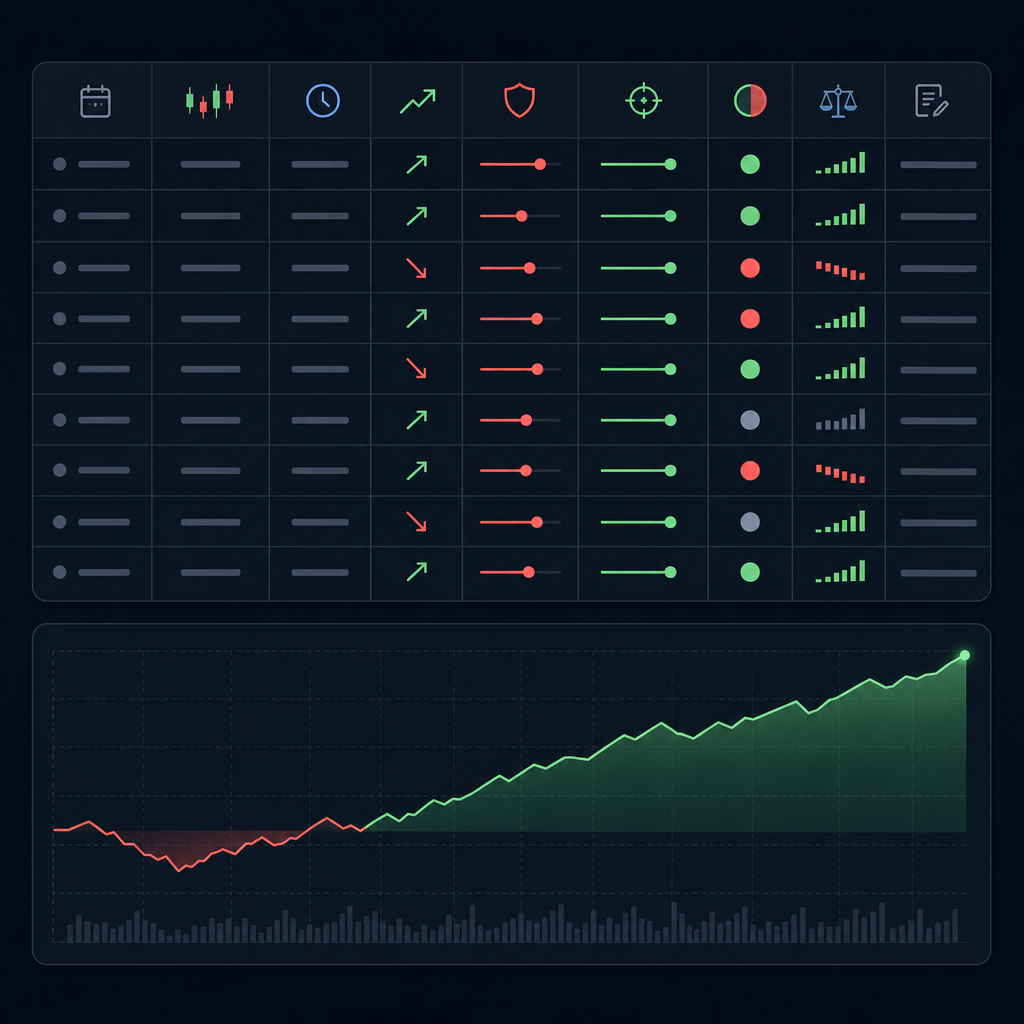
Core Columns (The Non-Negotiables)
- Date
- Symbol (XAUUSD, EURUSD, GBPUSD, USDJPY)
- Session (London / NY / Asia)
- Direction (Buy/Sell)
- Entry
- Stop Loss
- Take Profit (TP1/TP2 or final TP)
- Risk (pips or $)
- Result (R) (e.g., -1R, +2R, +0.5R)
- Notes (why taken, why skipped, execution mistakes)
Performance Columns (Where the Edge Shows Up)
- Planned R:R (e.g., 1:2, 1:3)
- Realized R (what you actually got)
- MFE/MAE (max favorable/adverse excursion)
- News proximity (none / yellow / red)
- Rule compliance (Yes/No)
MFE/MAE is a cheat code for improving execution. If your trades often go +1.5R then reverse to -1R, your management rules need work.
How to Calculate the Big Metrics
- Win rate: wins / total trades.
- Average win (R): mean of positive R results.
- Average loss (R): mean of negative R results (usually near -1R if you respect stops).
- Expectancy (R): (Win% × Avg Win) − (Loss% × Avg Loss).
- Max drawdown (R): largest peak-to-trough decline in cumulative R.
Example: Suppose your backtest on XAUUSD signals yields:
- Win rate = 52%
- Average win = +2.1R
- Average loss = -1.0R
Expectancy = 0.52×2.1 − 0.48×1.0 = 1.092 − 0.48 = +0.612R per trade.
That’s strong. Even with a modest win rate, the payoff carries the system.
Why Drawdown Matters More Than You Think
Most traders quit during drawdown, not because the strategy is broken, but because they didn’t expect the pain.
If your max drawdown is -12R, and you risk 2% per trade, that’s roughly -24% peak-to-trough. Many traders can’t handle that emotionally.
Backtesting lets you choose a risk level that keeps you in the game.
Backtesting XAUUSD Signals in TradingView: Gold-Specific Rules That Change Everything
Gold is not “just another pair.”
XAUUSD has its own personality: fast expansions, violent pullbacks, and frequent liquidity grabs around round numbers and prior highs/lows.
At $2650, gold is sitting in a range where intraday swings of $15–$30 can happen during active sessions. That means your backtest must include gold-specific rules, or your results won’t translate live.
1) Use Realistic Stops for Gold (Don’t Force FX Logic)
A common beginner error is using a $5 stop on XAUUSD because it “looks tight.”
In practice, gold can wick $6–$10 and still be perfectly valid.
For backtests within the $2610–$2690 guideline range, test stops like:
- Scalp style: $10–$12 SL (only if entry is very precise)
- Day trade style: $12–$20 SL
- Volatile/news days: $20–$25 SL (or skip entirely)
Then keep TP aligned with 1:2 or 1:3.
Example: Sell 2662, SL 2676 (risk $14). TP at 2R = 2634. TP at 3R = 2620.
2) Respect Round Numbers and Liquidity Pools
Gold loves round numbers like 2650, 2660, 2670.
In replay, watch how often price:
- Runs above a round number (e.g., 2660 → 2666)
- Then snaps back below it
This behavior can stop you out if your SL is placed exactly at an obvious level. Your backtest should record whether “obvious SL placement” is hurting you.
3) Session Timing Is Bigger on Gold Than Most FX Pairs
XAUUSD typically offers its cleanest moves during:
- London open (liquidity sweep setups, breakouts)
- NY open (expansion moves, trend continuation or reversal)
If you backtest gold signals across all hours, you may dilute performance with low-liquidity chop.
That’s why your journal must tag session. Later, you can compare:
- London-only stats
- NY-only stats
- All-session stats
4) News Filters Are Not Optional for Gold
Gold reacts aggressively to inflation data, Fed communication, and risk-off headlines.
If you want a deeper dive on how signals behave during surprise volatility, pair this guide with: how gold signals react to unexpected news events.
In your backtest, mark trades taken within red-news windows and compare drawdown. Many traders discover a simple rule like “no new entries 10 minutes before CPI” improves equity curve smoothness dramatically.
Backtesting Forex Signals: Pair-Specific Notes for EUR/USD, GBP/USD, USD/JPY
Forex majors are generally smoother than gold, but each pair has quirks that affect signal performance.
With current levels at EUR/USD 1.0520, GBP/USD 1.2680, and USD/JPY 149.50, you’re dealing with a market that’s still very USD-sensitive (DXY 106.80).
That means trends can accelerate when USD strengthens, and reversals can be sharp when yields pull back.
EUR/USD (1.0520): Cleaner Structure, Smaller Daily Range
- Often respects technical levels cleanly.
- Stops can be tighter relative to gold (e.g., 12–25 pips depending on timeframe).
- Breakouts can fail if liquidity is thin (late NY, Asia).
Backtest idea: Compare performance of EUR/USD signals during London/NY overlap vs. Asia. You may find win rate is similar but average R is higher during overlap because moves extend.
GBP/USD (1.2680): More Volatile, More Fakeouts
- Higher volatility than EUR/USD.
- Wickier around session opens.
- Can overshoot levels by 5–15 pips before reversing.
Backtest idea: Add a “buffer rule” for entries (e.g., wait for a 5m close beyond the level). Then measure if it improves drawdown without reducing R too much.
USD/JPY (149.50): Trendy, Sensitive to Rates and Intervention Risk
- Often trends strongly when yield differentials drive flows.
- Can spike violently on BOJ/Fed headlines.
- Intervention fear can create sudden reversals.
Backtest idea: Mark all trades near major policy events. USD/JPY can look perfect in replay and still be untradable live if spreads widen or price gaps.
Normalize Everything Using R
Don’t compare “+80 pips on GBP/USD” to “+$18 on gold” directly.
Compare R. That keeps your performance analysis clean and helps you decide position sizing across instruments.
If you’re actively following major-pair trade ideas, the best place to align your backtest with real alerts is our forex signals page, where the signal format stays consistent (entry/SL/TP).
Filters That Actually Improve Signal Performance (Session, Spread, News, Trend)
Most traders over-filter and kill opportunity.
But some filters genuinely improve performance, especially for signal followers who want consistency.
The key is to add filters one at a time and measure the impact on:
- Win rate
- Average R
- Expectancy
- Max drawdown
- Number of trades (opportunity cost)
Filter #1: London + New York Session Only
This is often the highest-impact filter for both forex and XAUUSD.
In replay, tag each trade as London, NY, overlap, or Asia. Then run your stats by session.
Many traders find:
- Asia has fewer clean expansions.
- London provides the first real directional move.
- NY either continues the trend or reverses it with power.
Filter #2: Spread/Volatility Filter
TradingView doesn’t perfectly simulate spread, but you can still create a practical proxy:
- Skip entries on unusually large candles relative to recent ATR.
- Skip if price is moving too fast into the entry zone (late entry risk).
For XAUUSD, if a 5m candle is $6–$8 and the next candle tags your entry, you may be buying the top of an impulse. Log it and see if those trades underperform.
Filter #3: Red-News Window
This is especially important when gold is near key levels like 2650 and macro sensitivity is high.
Backtest three approaches:
- Strict: no new trades 15 minutes before/after red news.
- Moderate: no new trades 10 minutes before/after.
- Flexible: allow trades if SL is wider and size is smaller.
Then compare drawdown. Often the strict filter reduces nasty outliers.
Filter #4: Higher-Timeframe Trend Alignment
Simple rule: only take buys above the 200 EMA on 1H, sells below.
Even if you’re not an indicator trader, this can reduce countertrend losses.
But don’t assume it helps. Test it.
Filter #5: “Late Signal” Rule
Signal arrives late. Price already moved.
Define a measurable rule like:
- Skip if price is more than 30% of SL distance away from entry.
Example: XAUUSD buy entry 2645, SL 2633 (risk $12). If price is already 2649.5 (4.5 away), that’s 37.5% of risk. Your rule says skip.
This single filter can dramatically improve your “signal-following realism,” because late entries are a top cause of frustration.
How to Decide: Follow, Skip, or Size Down (A Practical Decision Framework)
Backtesting isn’t just to prove a provider is “good.”
It’s to help you make better decisions on the next signal.
Here’s a framework that turns your journal stats into action.
Step 1: Define Your “Green Zone” Metrics
For many signal followers, a healthy baseline looks like:
- Expectancy: +0.20R or higher per trade (strong systems often exceed this)
- Max drawdown: tolerable for your psychology (e.g., under -10R)
- Rule compliance: 90%+ in backtest (if you can’t follow rules in replay, live will be worse)
If your tested expectancy is positive but drawdown is large, you don’t necessarily reject the signals. You adjust risk.
Step 2: Create Three Execution Modes
- Follow (normal size): all filters pass; session is London/NY; no red news nearby.
- Size down (half risk): one caution flag (late entry risk, volatility high, near news).
- Skip: multiple caution flags, or rule conflict.
This is how professionals stay consistent without being rigid.
Step 3: Use a Simple Position Sizing Rule
Pick a fixed percentage risk per trade (e.g., 0.5%–1%).
Then reduce it when conditions are messy.
Example for XAUUSD:
- Normal conditions: risk 1% with $12 stop.
- High volatility day: risk 0.5% with $20 stop.
Your dollar risk stays controlled even as SL changes.
Step 4: Track “Execution Errors” Separately from Signal Outcomes
In your journal notes, tag mistakes:
- Entered early
- Entered late
- Moved SL
- Took profit early
- Ignored news filter
This is where many traders discover something uncomfortable: the signal wasn’t the problem.
The execution was.
If you want a deeper mindset angle on why signal followers self-sabotage, read our breakdown of trading psychology mistakes signal followers make and compare it to your error tags.
Common Backtesting Mistakes (That Make “Good Signals” Look Bad)
Backtesting can lie to you in two directions:
- It can make a bad approach look good (curve fitting).
- It can make a good approach look bad (poor testing hygiene).
Here are the most common mistakes we see from traders backtesting forex and XAUUSD signals in TradingView.
Mistake #1: Peeking Into the Future
If you scroll right and see what happened, you will unconsciously “optimize” entries and exits.
Fix: only use Bar Replay and commit to decisions before candles print.
Mistake #2: Changing Rules Mid-Stream
You widen stops when it’s convenient, then brag about win rate.
Fix: write rules once for the test batch (e.g., 50 trades). Adjust only after the batch is complete.
Mistake #3: Not Accounting for Late Entries
In real life, you might see a signal 2–5 minutes late.
On gold, that can be the difference between entry at 2645 and entry at 2650.
Fix: add a “late entry simulation” where you delay entry by 1–2 candles sometimes and log the impact.
Mistake #4: Ignoring Session and News Context
A system can be profitable in London and terrible in Asia.
If you lump all trades together, you’ll get a meaningless average.
Fix: tag session and red-news proximity. Then segment results.
Mistake #5: Measuring Only Win Rate
A 65% win rate with +0.8R average win and -1R average loss is weak.
A 45% win rate with +2.5R average win and -1R average loss can be excellent.
Fix: track expectancy, drawdown, and distribution of outcomes.
Mistake #6: Over-Filtering Until You Have 10 Trades a Month
If your filters leave you with too few trades, your stats become fragile and your confidence collapses after a small losing streak.
Fix: keep filters simple and measurable. If a filter improves drawdown but reduces trades by 70%, think carefully.
How United Kings Traders Use This Workflow (Practical Integration With Telegram Signals)
If you’re following a Telegram signal service, your edge comes from two places:
- The provider’s analysis (setup quality, timing, levels).
- Your execution system (how you enter, manage, filter, and size).
United Kings is built for traders who want both.
We focus heavily on London and NY session opportunities, and our signals are delivered with clear structure: Entry, SL, TP. That clarity is exactly what makes backtesting easier and more honest.
Here’s how to integrate this guide with a real signal-following routine.
Step 1: Backtest the “Default Execution” First
Default execution means: you take the entry zone as given, you place SL where instructed, and you target the provided TP levels.
This gives you a baseline performance profile.
Step 2: Backtest Your Personal Filters
Now test your “skip conditions”:
- London/NY only
- avoid red news windows
- late entry rule
Measure whether your filters improve drawdown without destroying expectancy.
Step 3: Decide Your Risk Tier Per Condition
This is where many traders become consistent.
- Clean setup + good session + no news: normal risk.
- Messy volatility or late entry: size down.
- Red news imminent: skip.
Step 4: Keep Education and Signals Together
Signals alone won’t fix execution mistakes.
That’s why we share educational context alongside alerts, so you understand why a level matters and how to manage it.
If you’re primarily trading gold, start with our dedicated gold signals page and align your Bar Replay tests to XAUUSD behavior around levels like 2610–2690.
If you want the full multi-asset approach (forex + gold), explore all United Kings signals and build a journal that compares performance across instruments using R.
And if you want the community layer—trade recaps, ongoing discussion, and fast updates—join our Telegram here: United Kings Telegram trading community.
We currently have a community of 300K+ active traders, and while no results are guaranteed, the environment helps you stay consistent and accountable.
FAQ: Backtesting Forex & XAUUSD Signals in TradingView
1) How many trades should I backtest before trusting the results?
Aim for at least 50 trades for an initial read, and 100–200 trades for stronger confidence. Segment by session (London/NY/Asia) so you don’t average away the truth.
2) Can I backtest Telegram signals if I don’t have the old messages?
Yes. You can backtest the signal logic by recreating the same style of entries/exits on historical charts (levels, structure breaks, pullbacks). If you have a consistent provider format (Entry/SL/TP), it’s even easier to simulate.
3) What’s a good win rate for XAUUSD signals?
Win rate alone isn’t the goal. Many profitable gold approaches sit around 40%–55% win rate but deliver 2R–3R wins. Focus on expectancy and drawdown, not ego metrics.
4) How do I account for spread and slippage in TradingView replay?
You can’t simulate it perfectly. Use conservative assumptions: avoid testing razor-thin stops, add a small “execution buffer” in your journal notes, and validate with demo forward testing after replay proves the concept.
5) Should I backtest on 5m, 15m, or 1H?
Use two timeframes: a higher timeframe (1H/4H) for context and a lower timeframe (5m/15m) for execution. For XAUUSD near $2650, many traders find 15m execution reduces noise compared to 5m.
Risk Disclaimer (Read Before You Trade)
Forex and gold (XAUUSD) trading involves significant risk and is not suitable for all investors. Past performance, backtest results, or community-shared outcomes do not guarantee future results. Market conditions can change quickly due to economic data, central bank decisions, and geopolitical events. Always use stop losses, risk only what you can afford to lose, and consider practicing on a demo account before trading live. United Kings provides educational content and trade signals for informational purposes and does not guarantee profits.
Join United Kings Signals (Trade With Clarity, Not Guesswork)
If you’re serious about trading signals like a professional, the goal isn’t to take more trades.
The goal is to take better trades with a tested process.
United Kings delivers premium Telegram forex and gold signals with clear Entry, SL, and TP levels, built around the most liquid parts of the day (London and NY). We focus on consistency, education, and execution quality, with an experienced team and a community of 300K+ active traders.
You can explore our packages on the United Kings pricing page with three plans:
- Starter (3 Months): $299 (~$100/mo)
- Best Value (1 Year): $599 (~$50/mo) with 50% savings + FREE ebook
- Unlimited (Lifetime): $999 pay once, access forever
All plans come with a 48-hour money-back guarantee so you can evaluate the service with confidence.
Ready to start?
- Get access to our full suite: United Kings premium trading signals
- If you trade gold first: XAUUSD gold signals
- If you trade majors first: forex signals for EUR/USD, GBP/USD, USD/JPY and more
- Join the Telegram community now: United Kings on Telegram
Backtest the process. Journal the results. Then trade with a plan.