
You don’t need to become a full-time chart analyst to use forex and gold signals well.
But if you follow signals without any technical analysis forex basics, you’ll eventually run into the same pain: you enter late, you panic on the first pullback, you move your stop, and you blame the signal when the real issue was execution and context.
This guide is the middle path.
We’re not trying to replace professional signals. We’re teaching you the minimum effective forex chart analysis and trading indicators that help you understand what you’re taking, filter low-quality setups, and execute with confidence—especially in today’s market where Gold (XAUUSD) is hovering around $2650, DXY is elevated near 106.80, and volatility spikes around London and New York sessions.
TL;DR — What you actually need (and what you don’t)
- Learn market structure first (trend, range, break, retest). It beats memorizing 20 indicators.
- Use 2–3 indicators max for confirmation: a trend filter (MA), momentum (RSI), and volatility (ATR).
- Validate every signal with context: is price at a key level, in the right session, and aligned with the higher timeframe?
- Stops and targets should “make sense” on the chart: for XAUUSD, typical SL is $10–$25 from entry with 1:2 or 1:3 RR.
- News and liquidity matter: spreads and slippage can invalidate a perfect setup in seconds.
- Your edge as a signal trader is execution: position sizing, discipline, and not taking every alert.
Why signal traders still need technical analysis forex basics
Signals give you the “what”: entry, stop loss, take profits, and sometimes the reasoning.
Technical analysis gives you the “why” and “when”: whether the setup is aligned with current structure, whether the stop is placed in a logical location, and whether the timing is likely to be clean or messy.
Here’s the key: technical analysis for signal traders is not about predicting. It’s about verification.
When Gold is around $2650 and moving 15–30 dollars in a session, a $15 stop can be either smart or suicidal depending on volatility and where you are on the chart.
Same with EUR/USD around 1.0520. A 20-pip stop might be fine during calm Asia, but during London open it can get clipped in seconds if you’re entering into a liquidity sweep.
Technical analysis helps you answer practical questions before you click buy/sell:
- Is price trending or ranging?
- Is the entry near support/resistance or in the middle of nowhere?
- Is the stop beyond a structure level, or sitting where everyone puts stops?
- Is the target realistic before the next major barrier?
- Is this happening in a high-quality session (London/NY) or low-liquidity chop?
If you’re new to how signals are built and delivered, read our step-by-step breakdown of how forex signals work and then come back here to upgrade your chart filter.
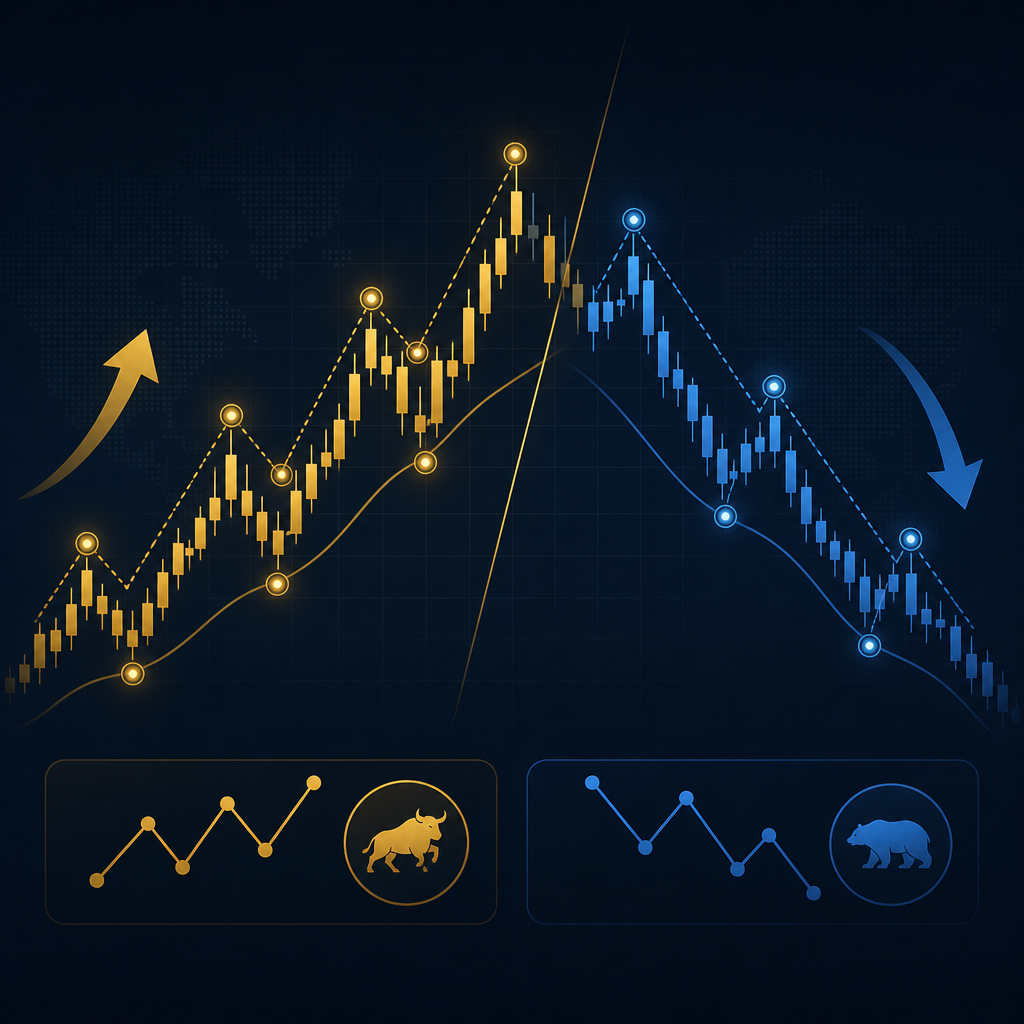
Market structure: the only “indicator” you can’t skip
If you learn nothing else from this article, learn structure.
Structure is the story of price: where buyers defended, where sellers hit back, and what changed when one side finally broke.
For signal traders, structure is the difference between “this looks like a good buy” and “this buy is directly into resistance.”
Step 1: Identify trend vs range (in 60 seconds)
Open a higher timeframe first (H4 or D1). Don’t start on M5.
Then ask:
- Uptrend: higher highs (HH) and higher lows (HL).
- Downtrend: lower lows (LL) and lower highs (LH).
- Range: price oscillates between a ceiling and a floor.
Example: if XAUUSD is printing higher lows above $2610–$2620 and repeatedly pushing into $2680–$2690, you’re likely in a bullish structure with a clear resistance band.
That means a buy signal near $2625–$2640 (support zone) is structurally cleaner than a buy signal at $2685 (right under resistance).
Step 2: Mark the “decision points” (not every candle)
Signal traders often overdraw lines. You don’t need 12 levels.
Mark only:
- Recent swing high and swing low (last 1–2 weeks on H4/D1).
- Major round numbers (Gold: 2600, 2650, 2700; FX: 1.0500, 1.0600, etc.).
- Obvious consolidation breaks (where price launched fast).
These are your “decision points.” If a signal’s entry is near one, your confidence increases because the market is reacting to a real level.
Step 3: Understand break-and-retest (the signal trader’s best friend)
Many premium signals are essentially structured around break-and-retest logic.
Example on Gold:
- Price breaks above $2660 with momentum.
- It pulls back to $2660–$2655.
- Buy entry triggers on confirmation.
- SL sits below the retest low, say $2642 (about $15–$20 risk).
- TP aims for $2690 (around $30–$40 reward = 1:2 to 1:3).
This is not magic. It’s structure plus liquidity.
When you can see that on your chart, you stop feeling like signals are random messages—and you start executing like a professional.
Support & resistance for signal followers (zones, not lines)
Most losing signal followers treat support and resistance like laser-thin lines.
Price doesn’t respect lines. It respects areas.
That’s why we use zones: a band where orders are likely sitting, not a single pip level.
How to draw a zone in 3 steps
- Step 1: Find a swing point where price reversed hard (impulsive move).
- Step 2: Mark the candle bodies that created the reversal (not the farthest wick).
- Step 3: Extend the zone to the right and watch how price reacts later.
On XAUUSD around $2650, a practical way to zone:
- Support zone: $2620–$2635 (if multiple bounces happened there).
- Resistance zone: $2680–$2690 (if multiple rejections happened there).
Now you can filter signals quickly:
- Buy signal inside support zone: higher quality.
- Buy signal 2 dollars below resistance: lower quality unless it’s a breakout setup.
Common trap: “middle of the range” entries
Let’s say Gold is ranging between $2625 and $2685.
A buy signal at $2652 might still win, but it’s structurally less attractive because you’re buying in the middle—where random noise lives.
As a signal trader, you can either:
- Reduce risk (smaller lot size), or
- Wait for a better price (limit entry), or
- Skip it if your plan allows filtering.
This is exactly how experienced traders protect their equity without needing to “outsmart” the market.
If you want a clean execution framework, pair this article with our guide on risk management strategies when using signals.
Trendlines, channels, and “clean chart” forex chart analysis
Trendlines are useful, but only if you use them like a professional.
The goal isn’t to force a line to fit price. The goal is to identify whether the market is respecting a slope—meaning participants are defending pullbacks consistently.
The 2-touch rule (and why 3 touches matter)
A trendline needs two touches to exist.
It becomes meaningful after three touches.
For signal traders, this matters because the third touch often creates a clean “reaction trade” zone where signals tend to perform well.
Channels: the easiest way to set realistic take profits
When price travels in a channel, it gives you a built-in target framework.
Example: EUR/USD around 1.0520 is drifting lower in a descending channel.
If you receive a sell signal at 1.0530 with SL at 1.0550 (20 pips risk), you can check whether the channel’s lower boundary sits near 1.0490.
That would give you ~40 pips reward (1:2). If the boundary is only 15 pips away, the signal’s TP may be too optimistic.
Clean chart checklist (what to keep, what to remove)
- Keep: structure highs/lows, 2–4 zones, one trendline or channel.
- Remove: too many indicators, too many Fibonacci grids, random diagonal lines.
- Goal: you should understand the chart in 10 seconds.
This “clean chart” approach is why professional desks can make fast decisions during volatile London/NY moves.
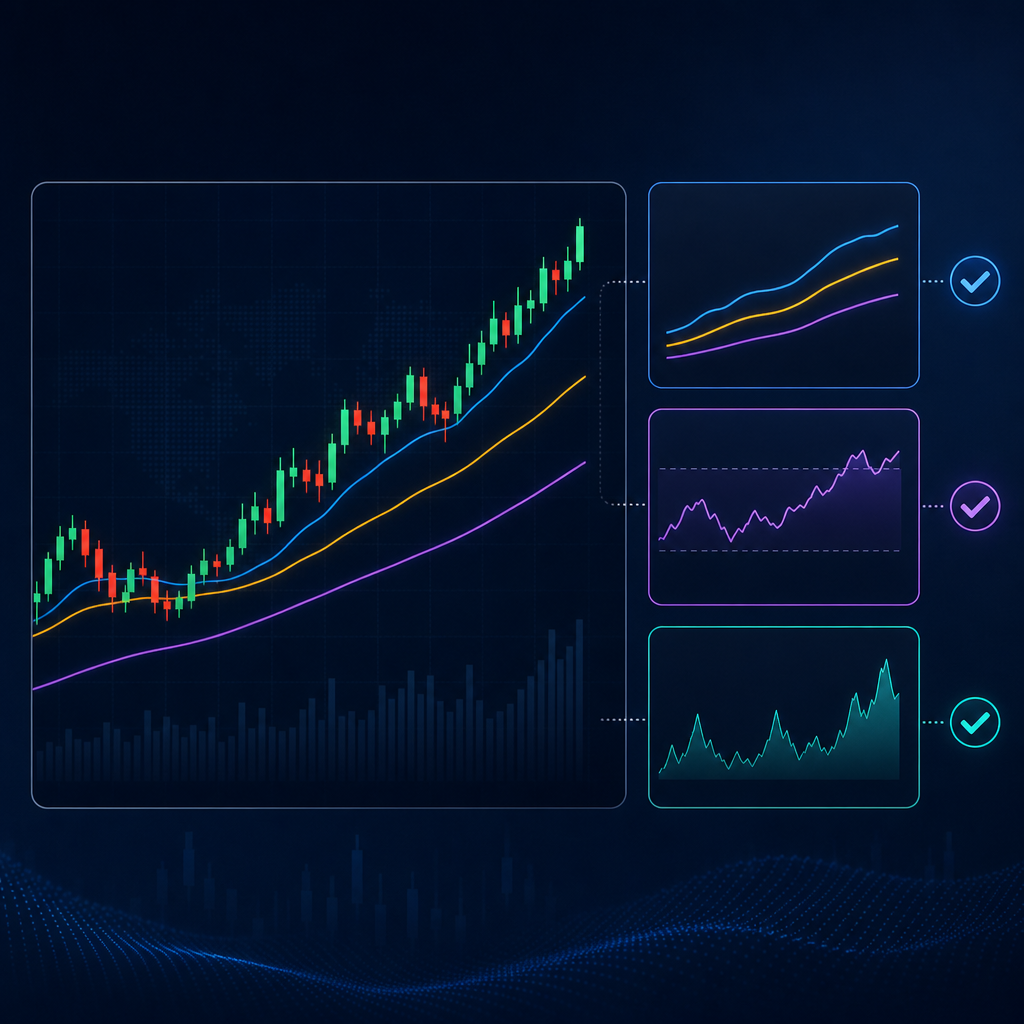
Trading indicators: the only 3 you need to filter signals
Most signal traders misuse indicators by treating them as entry triggers.
Use indicators as confirmation tools, not decision-makers.
In practice, you can filter 80% of low-quality trades with just three: a moving average, RSI, and ATR.
1) Moving Average (trend filter)
Pick one: 50 EMA or 200 EMA.
Rule of thumb:
- Price above MA and MA rising: prioritize buys.
- Price below MA and MA falling: prioritize sells.
Example: USD/JPY is around 149.50 with DXY strong at 106.80. If USD/JPY is above the 50 EMA on H1 and H4, sell signals are countertrend and require extra caution (smaller risk or skip).
2) RSI (momentum and “don’t buy the top” filter)
RSI is not a “buy at 30, sell at 70” machine.
For signal traders, RSI is best used to avoid bad timing:
- If RSI is above 70 and price is at resistance, a fresh buy signal is higher risk.
- If RSI is below 30 and price is at support, a fresh sell signal is higher risk.
On Gold near $2685, if RSI is already stretched and price is tapping your resistance zone, you can expect pullbacks and stop hunts.
3) ATR (volatility-based stop sanity check)
ATR tells you the “typical” movement size.
Why it matters: a $10 stop on Gold can be tight or fine depending on volatility.
Example: if XAUUSD ATR(14) on H1 is around $6, then a $12–$18 stop is reasonable for an intraday signal.
If ATR jumps to $10 during NY news, that same $12 stop becomes fragile.
Comparison table: indicator roles for signal traders
| Tool | What it tells you | Best use for signal followers | Common mistake |
|---|---|---|---|
| 50/200 EMA | Trend direction & bias | Filter: trade with trend, size down countertrend | Using MA crossovers as late entries |
| RSI (14) | Momentum & stretch | Avoid buying into resistance when momentum is exhausted | Blindly selling at 70 / buying at 30 |
| ATR (14) | Typical volatility | Check if SL is realistic for current conditions | Ignoring volatility changes during news |
| Support/Resistance | Where orders cluster | Confirm entry/TP placement around real levels | Drawing 20 levels and freezing |
Entry, SL, TP logic: how to “audit” a signal in 90 seconds
Professional signal providers (including us) send clean entries with SL/TP.
Your job is not to reinvent them. Your job is to audit them quickly so you can execute without hesitation.
The 90-second signal audit (step-by-step)
- Step 1: Identify the market type. Trending or ranging on H4?
- Step 2: Locate the entry. Is it at a zone, a retest, or mid-range?
- Step 3: Validate the stop. Is SL beyond structure, or sitting at an obvious stop-hunt spot?
- Step 4: Validate the target. Is TP before the next major level?
- Step 5: Check session & news. London/NY = good liquidity; major news = caution.
Gold example using realistic levels (XAUUSD ~ $2650)
Assume you receive:
- BUY XAUUSD @ 2648
- SL 2633 (risk = $15)
- TP1 2678 (reward = $30, 1:2)
- TP2 2693 (reward = $45, 1:3)
Your audit:
- Is 2648 near a support zone (e.g., 2640–2650)? If yes, good.
- Is 2633 below the last swing low or below the zone? If yes, logical.
- Is 2678 below resistance near 2680–2690? If yes, realistic TP.
Now you can execute calmly, because the trade is anchored to structure—not hope.
Forex example (EUR/USD ~ 1.0520)
Assume:
- SELL EUR/USD @ 1.0525
- SL 1.0545 (20 pips)
- TP 1.0485 (40 pips, 1:2)
Audit:
- Is 1.0525 at a retest of broken support (now resistance)?
- Is 1.0545 above the swing high and above the zone?
- Is 1.0485 above the next support where price may bounce?
If “yes” across the board, it’s a structurally sound setup.
Multi-timeframe analysis for signal traders (without the overwhelm)
Multi-timeframe analysis sounds advanced, but for signal followers it’s simple: use higher timeframes to avoid trading into the wall.
You don’t need 12 charts. You need three views: context, setup, and execution.
The 3-chart workflow
- D1 (Daily): Big trend and major levels. Where are we in the weekly story?
- H4: Structure and zones. Where are the clean swing points?
- H1/M15: Entry timing. Is price confirming or sweeping liquidity?
Example with Gold:
- D1 shows price holding above $2610–$2620 and pushing higher overall.
- H4 shows a consolidation under $2680–$2690.
- M15 shows a sweep below $2645 and then a strong reclaim back above $2650.
If you get a buy signal after that reclaim, it’s aligned: higher timeframe bias up, mid timeframe support, lower timeframe trigger.
How to spot “countertrend” signals early
Countertrend signals can work, but they require tighter execution and realistic targets.
Use this simple rule:
- If D1 and H4 are bullish, treat sells as quick scalps (smaller TP, faster management).
- If D1 and H4 are bearish, treat buys as bounces, not reversals (take profit sooner).
This single adjustment can reduce drawdown dramatically for signal traders.
Why this matters right now (DXY 106.80 context)
With DXY elevated around 106.80, USD strength can pressure EUR/USD and GBP/USD while supporting USD/JPY.
So if you see a GBP/USD buy signal near 1.2680, you should quickly check whether the higher timeframe is still in a downtrend.
If yes, you either size down or demand a stronger confirmation (break and retest) before you commit.
Price action patterns signal traders should recognize (and ignore)
Price action is often overcomplicated online.
As a signal trader, you only need to recognize a handful of patterns that show who is in control and whether an entry is likely to hold.
Patterns worth knowing
- Break and retest: Best for continuation signals.
- Double top/bottom (with confirmation): Useful for reversal warnings near major zones.
- Pin bar / rejection candle: Shows aggressive defense at a level.
- Inside bar: Compression that often breaks with momentum in active sessions.
Gold scenario: rejection + level = high-probability reaction
Imagine Gold spikes to $2688 during NY, tags a resistance zone, and closes a strong rejection candle back below $2680.
If you then receive a sell signal around $2678 with SL at $2698 (risk $20) and TP at $2638 (reward $40), the story makes sense: rejection at resistance, room to fall toward support.
Even if you don’t take the signal, you now understand it.
Patterns to ignore (for signal followers)
- Over-fitted harmonic patterns that require perfect ratios.
- Random “head and shoulders” drawn on noisy lower timeframes.
- Anything that needs 8 confirmations before you can act.
Your job is speed and clarity. If a pattern takes 10 minutes to explain, it’s not helping your execution.
Sessions, liquidity, and why timing changes signal accuracy
Two traders can take the same signal and get different outcomes.
The difference is often timing—especially around session opens when liquidity shifts and stop hunts are common.
London and New York: where signals perform best
Most high-quality moves happen in:
- London session: strong directional moves, especially EUR/USD and GBP/USD.
- New York session: follow-through, reversals, and major news volatility.
- London–NY overlap: peak liquidity, often best spreads and cleaner fills.
This is why United Kings focuses heavily on London and NY session trading and sends premium Telegram alerts designed for those windows.
Liquidity sweeps (the “why did it hit my SL then moon?” problem)
A liquidity sweep is when price briefly pierces a level to trigger stops and fill large orders, then reverses.
Gold example:
- Support zone at $2640–$2645.
- Price spikes down to $2638 for 2 minutes.
- Then it rallies to $2675.
If your buy signal SL was at $2640, you got clipped by $2–$3 and watched it run.
Technical analysis helps you anticipate this and decide whether the SL is placed in a “magnet” area.
Simple timing rule for signal execution
- Avoid entering right at London open or NY open if spreads widen and candles spike.
- Prefer entering after the first 5–15 minutes when direction becomes clearer.
- If the signal is a limit order at a zone, it’s often safer than a market order during spikes.
For deeper timing tactics, our readers also like the session execution content inside the United Kings blog, especially around slippage and overlap behavior.
How to filter signals without overthinking (a practical checklist)
Filtering is not about rejecting most trades.
Filtering is about avoiding the few trades that do the most damage: entries into major levels, trades during chaotic news, and countertrend setups with unrealistic targets.
The “green/yellow/red” filter
Use a simple traffic-light system.
- Green (take it): aligned trend + at a level + good session + clean RR.
- Yellow (reduce risk): one factor is off (mid-range entry, countertrend, or high ATR).
- Red (skip): multiple conflicts (into resistance, news in 5 minutes, messy structure).
Concrete example: GBP/USD around 1.2680
Assume a buy signal at 1.2685.
Green if:
- H4 is making higher highs/higher lows.
- Entry is near support (e.g., 1.2680–1.2690 zone).
- DXY is not ripping higher at the same time.
Yellow if:
- Entry is mid-range and the next resistance is only 20–25 pips away.
- RSI is stretched and you’re buying into a prior swing high.
Red if:
- Major USD news is imminent and spreads are widening.
- Daily trend is bearish and the buy is just a small bounce with a big target.
Keep your filter consistent (don’t change rules mid-week)
The biggest mistake is changing your filter after one loss.
Commit to a checklist for 30 trades, then review results. That’s how you build a process instead of chasing emotions.
If you want a full evaluation framework for choosing and judging providers, use our forex signals provider checklist alongside this technical filter.
Execution and risk: turning good signals into good results
Signals don’t blow accounts. Execution does.
Even with an 85%+ win rate provider, poor sizing and emotional management can turn a profitable month into a drawdown.
Position sizing in plain English
Pick a fixed risk per trade (example: 1% of account).
Then size your lot based on stop distance.
Gold example:
- Account: $5,000
- Risk per trade: 1% = $50
- Stop: $15
Your lot size should be calculated so that a $15 move against you equals ~$50 loss (your platform can calculate this, or you can use a position size calculator).
The key principle: the stop defines the lot, not your emotions.
Trade management: partials and moving to breakeven (when it’s logical)
Many traders move to breakeven too early and get stopped out of winners.
A better approach:
- Consider moving SL to breakeven only after price breaks a structure level in your favor.
- Take partial profit at 1R (risk amount) if it fits your plan.
- Let the remainder run to TP2/TP3 when trend conditions support it.
Example: Buy XAUUSD at $2648 with SL $2633 (risk $15).
- At $2663 (+$15 = 1R), you can take partials.
- Move SL to breakeven only if price holds above $2658–$2660 (a reclaimed level).
Slippage and spread: the hidden cost signal traders underestimate
In fast markets, you might get filled 2–10 pips worse on FX, or $0.50–$2 worse on Gold depending on broker conditions.
That can change your risk-reward.
To reduce friction:
- Use limit orders when the setup is level-based.
- Avoid entering during the first minute of major news.
- Trade during high-liquidity sessions when spreads are tighter.
If you’re serious about execution quality, explore our premium signal hubs: forex signals and gold signals, where entries and management rules are designed for real-world fills.
Putting it all together: a weekly routine for signal traders (15 minutes/day)
The best signal traders don’t stare at charts all day.
They run a simple routine that keeps them aligned with the market and ready to execute.
Sunday prep (20–30 minutes)
- Mark weekly highs/lows on XAUUSD, EUR/USD, GBP/USD, USD/JPY.
- Identify the current “theme” (USD strength with DXY ~106.80, risk-on/off tone).
- Note major scheduled events (central bank speakers, CPI, NFP).
Daily routine (10–15 minutes)
- Step 1: Check D1/H4 structure (trend or range).
- Step 2: Update 2–4 key zones (support/resistance).
- Step 3: Check volatility (ATR) and whether stops need more breathing room.
- Step 4: Decide your filter stance for the day (green/yellow/red conditions).
When a signal arrives (your 60-second execution protocol)
- Confirm entry is not directly into a major zone.
- Confirm SL is beyond structure (not inside the noise).
- Confirm TP is realistic before the next barrier.
- Place order with correct lot size and no improvisation.
End-of-day review (5 minutes)
- Screenshot 1–2 trades (win or loss).
- Write one sentence: “Did I follow the plan?”
- Track execution mistakes (late entry, moved SL, oversized).
This routine is how you turn signals into a repeatable process instead of a gamble.
FAQ: Technical analysis for signal traders
Do I need to learn technical analysis if I already follow premium signals?
You don’t need deep chart mastery, but you do need basics. Market structure, key levels, and a volatility check help you execute better and avoid low-quality timing.
What timeframe is best for forex chart analysis as a signal follower?
Use D1 and H4 for context, then H1/M15 for entry timing. This keeps you aligned with the bigger trend while still seeing liquidity sweeps and retests.
Which trading indicators are best for filtering signals?
A simple set works best: one moving average (50 or 200 EMA) for trend, RSI for momentum stretch, and ATR for volatility-based stop sanity checks.
How do I know if a stop loss is “too tight” on XAUUSD?
Compare the stop distance to recent volatility (ATR) and structure. In the current $2610–$2690 environment, many intraday gold trades need roughly $10–$25 SL depending on session and news.
Should I skip signals during major news?
If you’re a beginner, yes—at least avoid entering in the minute before and after high-impact releases. Slippage and spikes can invalidate clean technical setups.
Risk Disclaimer: Forex and gold trading involves significant risk and may not be suitable for all investors. Past performance does not guarantee future results. Signals and analysis are educational and informational, not financial advice. Always use stop losses, manage position size responsibly, and consider practicing on a demo account before trading live. You can lose more than your initial deposit with leveraged products depending on your broker’s terms.
Ready to trade with clarity (not confusion)? Join United Kings
If you want signals and the technical context to execute them like a pro, join the United Kings community.
We provide premium Telegram forex and gold signals with clear Entry, SL, and TP levels, built for London and New York session conditions.
You also get educational guidance alongside alerts—so you’re not just copying trades, you’re improving with every week.
- 85%+ win rate focus with structured setups and clean risk-reward planning
- 300K+ active traders in our global community
- 48-hour money-back guarantee for peace of mind
Explore our full signals offering here: United Kings signals.
Or go directly to what you trade most:
Choose a plan that fits your goals on our pricing page:
- Starter (3 Months): $299 (~$100/mo)
- Best Value (1 Year): $599 ($50/mo) + FREE ebook (50% savings)
- Unlimited (Lifetime): $999 (pay once)
Want to see alerts and community updates in real time? Join our official Telegram: United Kings Telegram trading channel.
Next step: Pick your plan, follow the 90-second audit, and start trading signals with confidence instead of guesswork.