You don’t need to become a full-time chart analyst to use signals well.
But if you’re following signals without understanding even basic technical analysis forex principles, you’re trading blind. That’s how traders panic-close winners, hold losers, and blame “bad signals” when the real problem is execution, context, and expectations.
This guide is the practical middle ground. We’re not turning you into a discretionary day trader. We’re giving you the minimum effective technical toolkit to understand signals, filter low-quality setups, and execute with calm—especially in fast markets like gold (XAUUSD) around $2650 and major FX pairs like EUR/USD 1.0520 and USD/JPY 149.50.
TL;DR: Technical analysis for signal traders (what you actually need)
- Start with structure, not indicators: identify trend, range, and key levels before you judge any signal.
- One clean level beats five indicators: support/resistance zones and session highs/lows explain most signal outcomes.
- Use indicators as confirmation only: RSI, moving averages, and ATR help manage entries and stops—don’t let them “decide” for you.
- Always check the calendar and volatility: news + spreads can invalidate even a perfect chart setup.
- Match the signal timeframe: scalps need session structure; swings need daily/4H bias and patience.
- Execution is a skill: the best signal is useless if you enter late, move SL, or ignore risk rules.
Why signal traders still need technical analysis forex skills
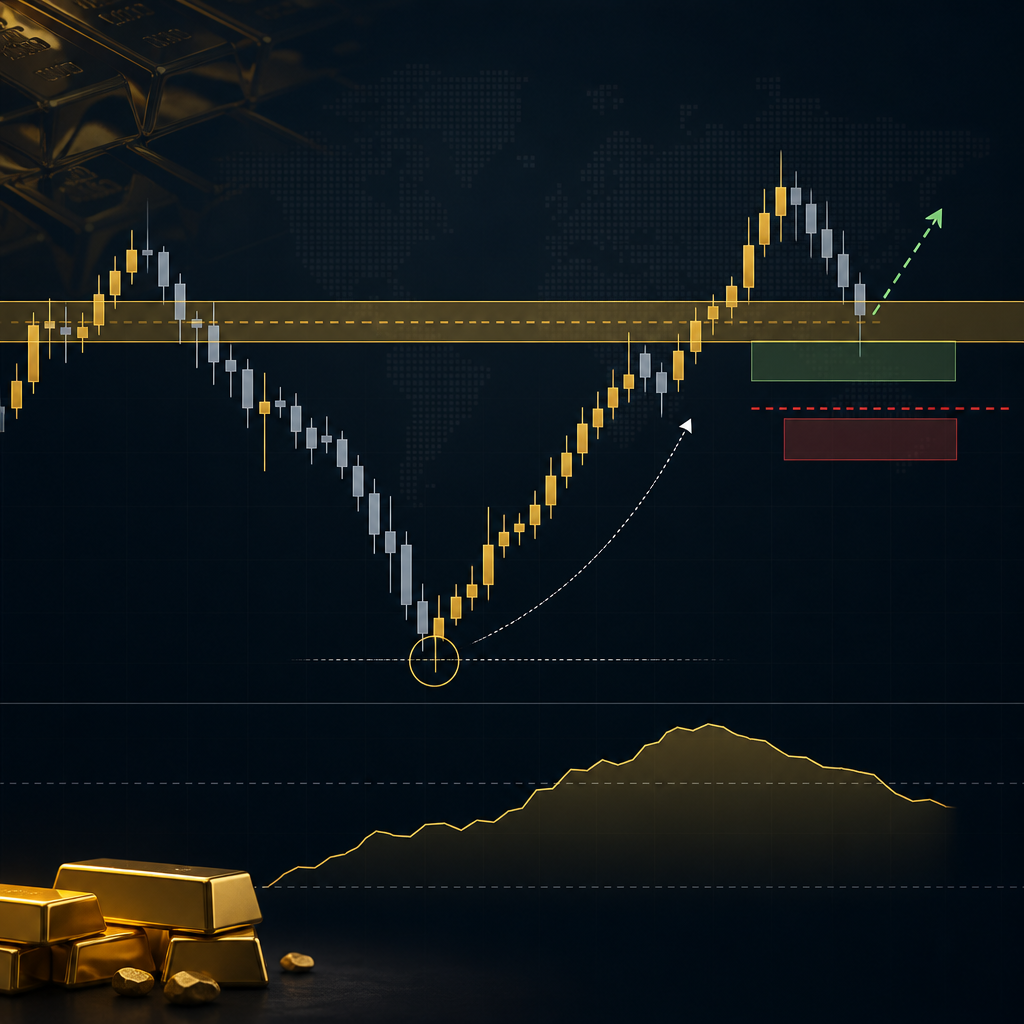
Signals are like GPS directions. They’re powerful, but you still need to know if the road is closed, if there’s traffic, and whether you’re driving the right vehicle for the route.
When you join a premium provider, you’re outsourcing analysis. That’s smart. But you’re not outsourcing responsibility for your account, your risk, or your execution.
Here’s what technical analysis does for a signal follower:
- Context: You understand whether a buy is “with trend” or a counter-trend scalp.
- Confidence: You can hold through normal pullbacks instead of panic-closing at -$3 on gold.
- Filtering: You can avoid the worst times (illiquid hours, major news spikes, wide spreads).
- Position sizing: You can align lot size with stop distance and volatility instead of guessing.
- Learning: Every signal becomes a lesson, not just a win or loss.
At United Kings, we publish clear entry, SL, and TP levels and focus heavily on London and New York session opportunities. If you can read basic structure and key levels, you’ll execute our setups more consistently and understand why they work.
If you’re new to following signals, pair this guide with our educational resources on the United Kings blog and the practical execution tips inside our community on United Kings Telegram.
The only chart framework you need: structure → levels → trigger
Most traders start with indicators. Professional traders start with structure.
When a signal comes in—say XAUUSD buy around $2652 with SL $2640 and TP $2676—you want to answer three questions quickly.
1) Structure: is the market trending or ranging?
On any pair, structure is simply the sequence of swing highs and swing lows.
- Uptrend: higher highs + higher lows (buyers in control).
- Downtrend: lower highs + lower lows (sellers in control).
- Range: price oscillates between boundaries (mean reversion dominates).
In the current context, gold around $2650 often trades with sharp intraday swings. It can trend strongly during NY, then revert during late session. Your job is to identify what phase you’re in before you judge a signal.
2) Levels: where is liquidity likely sitting?
Signals work best when they align with obvious levels where other traders place orders.
- Prior day high/low
- Asian session range high/low
- Weekly high/low
- Round numbers (XAUUSD 2650, 2660, 2670; EUR/USD 1.0500, 1.0550)
For example, if USD/JPY is hovering near 149.50 and repeatedly rejects 149.80, that area becomes a “decision zone.” A signal that sells into that resistance makes more sense than one that buys directly into it.
3) Trigger: what confirms the entry?
Triggers are the “go” signal. As a signal follower, you don’t need to invent triggers—you need to recognize them so you don’t enter late or at the wrong time.
- Break and retest: price breaks a level, retests it, then continues.
- Rejection candle: long wick into a level, close back inside.
- Engulfing: strong reversal candle after a sweep of highs/lows.
This framework—structure → levels → trigger—will cover 80% of what you need for forex chart analysis as a signal trader.
Support and resistance zones: the signal trader’s best filter
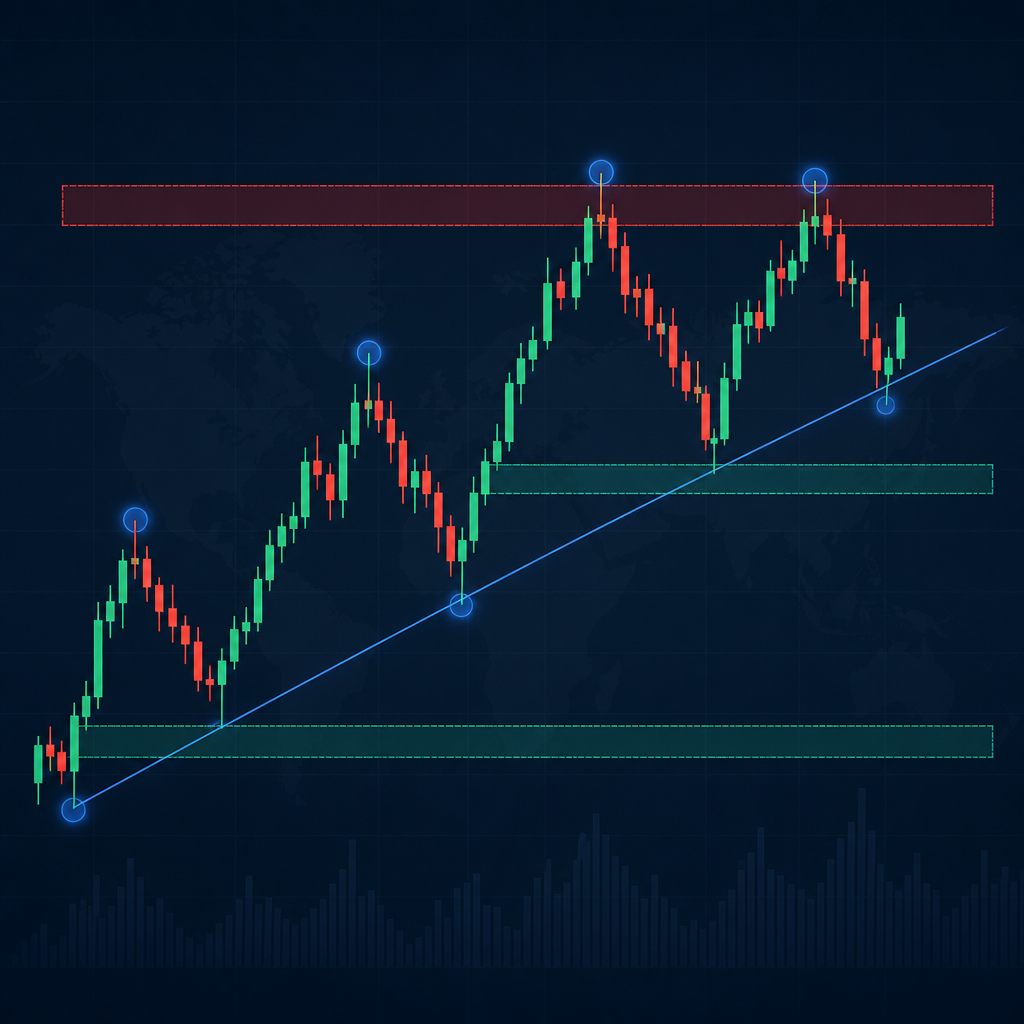
If you learn only one technical skill, learn to mark zones, not razor-thin lines.
Support and resistance are not magic. They’re simply areas where enough traders agree on value that price reacts. Signals tend to perform better when entries are placed near these zones, and worse when entries are placed in “no-man’s land.”
How to draw zones in 3 steps
Step 1: Start on the higher timeframe (H4 or Daily). Mark the most obvious turning points.
Step 2: Convert lines into zones by including wick extremes. On gold, a $2–$5 “zone thickness” is normal; during higher volatility, $6–$10 can be reasonable.
Step 3: Drop to the execution timeframe (M15–H1) and refine. Don’t overfit. Keep it clean.
What to look for when a signal arrives
- Is the entry near support for a buy? For XAUUSD, a buy at $2652 makes more sense if you see support around $2648–$2652.
- Is the take profit into resistance? If TP is $2676, check if there’s a known supply zone around $2675–$2680. That’s logical targeting.
- Is the stop loss beyond the zone? A stop at $2640 is ~12 points away. If the support zone ends at $2645, placing SL below it is technically sound.
On EUR/USD at 1.0520, the same logic applies. A buy signal at 1.0520 is higher quality if the chart shows a demand zone around 1.0505–1.0520 and the TP targets a prior high like 1.0560.
Want a deeper execution framework specifically for signal entries, stops, and partials? Pair this with our guide on risk management strategies when using forex signals.
Market sessions and volatility: why London/NY timing changes everything
Two traders can take the same signal and get different results simply because of timing.
That’s why United Kings focuses heavily on London and New York sessions. Liquidity increases, spreads tighten, and follow-through becomes more reliable.
Session behavior (practical version)
- Asia: often range-bound for FX majors; gold can still move, but follow-through may be choppy.
- London: breakouts and trend days often begin here. Fakeouts also happen—especially around the Asian range edges.
- New York: continuation or reversal depending on data releases and positioning. Gold can accelerate sharply.
In the current environment, DXY around 106.80 signals a firm dollar backdrop. That can add headwind to EUR/USD and support USD/JPY strength. For gold at $2650, the relationship with the dollar and yields can create sudden spikes—especially around US data.
A simple volatility check before you execute
You don’t need a complex model. Use these quick checks:
- Spread check: if gold spread widens unusually (e.g., from $0.20 to $0.80), be cautious.
- Candle size check: if the last 3–5 M15 candles are huge, stops need more room or position size needs to shrink.
- News proximity: avoid entering 2–5 minutes before major releases unless the signal explicitly accounts for it.
This is exactly why we recommend combining signals with a basic calendar routine. If you want a dedicated guide on how news impacts signal performance, read how gold signals react to unexpected news events.
Indicators signal traders should use (and how not to misuse them)
Indicators are tools. They’re not decision-makers.
If you’re following signals, indicators should help you do three things: confirm context, avoid bad entries, and manage risk. Anything beyond that usually creates hesitation and late execution.
Moving averages (MA): trend filter, not entry trigger
A simple 50 EMA on H1 or H4 can help you see bias.
- Price above MA: bullish environment; buy signals have higher probability.
- Price below MA: bearish environment; sell signals have higher probability.
Example: If GBP/USD is 1.2680 and sitting below the H4 50 EMA, a sell signal into a retest zone like 1.2700 may align better than a buy chasing into resistance.
RSI (14): momentum and divergence, not “overbought/oversold” alone
Many traders misuse RSI by selling just because it’s above 70. In strong trends, RSI can stay “overbought” for hours.
Better use:
- Trend confirmation: RSI holding above 50 supports bullish bias; below 50 supports bearish bias.
- Divergence warning: price makes a higher high but RSI makes a lower high—momentum fading.
On XAUUSD, if price pushes from $2658 to $2668 but RSI fails to confirm, you may tighten execution (wait for a retest) rather than market-buying at the top of a spike.
ATR: the most underrated tool for stop sizing
ATR (Average True Range) tells you typical movement. It helps you avoid placing stops inside “normal noise.”
If gold’s M15 ATR is around $3.0 in a volatile NY session, a $6 stop can be reasonable for a scalp. If ATR is $5.0, a $10 stop may be the minimum to avoid random stop-outs.
This aligns with our typical gold SL guidance of $10–$25 depending on setup and volatility.
What to avoid as a signal trader
- Too many indicators: conflicting signals cause hesitation.
- Indicator stacking: “RSI + MACD + Stoch + Bollinger” often duplicates information.
- Changing settings constantly: it becomes curve-fitting, not analysis.
If you want to see what advanced tools professional signal systems may use behind the scenes, read our related post advanced technical indicators that power forex signal systems—but keep your personal chart simple.
Price action patterns that matter for forex chart analysis (and signal confidence)
Price action is the language of the market. You don’t need to memorize 50 patterns. You need a few that show up constantly and align with how signals are built.
1) Breakout and retest (the bread-and-butter)
This is one of the cleanest “signal-friendly” patterns because it provides structure for entry, SL, and TP.
- Break: price closes beyond a key level (not just wicks through).
- Retest: price returns to the level and holds.
- Continuation: price resumes direction with momentum.
Gold example: price breaks above $2658, retests $2658–$2656, then pushes toward $2676. A signal entry around $2658–$2660 with SL $2648 targets a 1:2+ outcome (risk $10 to make $16+).
2) Liquidity sweep (stop-hunt) into reversal
Markets love taking out obvious highs/lows because that’s where stop orders sit.
Signal traders should recognize this because it explains why a setup may briefly go negative before moving to profit.
- Price spikes above a prior high (triggers stops).
- It quickly returns below (buyers trapped).
- Reversal begins with strong bearish candles.
Example: EUR/USD sweeps above 1.0540, then closes back under 1.0530. A sell signal with SL above 1.0550 now makes sense because the “trap” failed.
3) Pin bar / rejection candle at a zone
A long wick into a zone with a close away from it shows rejection.
On XAUUSD, a rejection at $2680 after a fast run can justify a short scalp back to $2665, especially if the move happened into NY resistance.
4) Inside bar (compression before expansion)
Inside bars show consolidation. Breakouts from them often move fast.
As a signal follower, this matters because it helps you anticipate momentum. If you see a tight inside bar cluster near a key level, be ready for quick execution when the signal triggers.
A practical checklist to filter signals in 60 seconds
You don’t need to overanalyze. You need a repeatable process.
Here’s a simple 60-second filter you can run every time a signal arrives in Telegram.
Step-by-step: the 60-second signal filter
Step 1: Identify the timeframe. Is it a scalp (M5–M15) or intraday (M15–H1) or swing (H4–Daily)? If you don’t know, ask in the community.
Step 2: Check structure. Are we trending or ranging? If the signal is counter-trend, expect lower win rate but higher reward potential and tighter management.
Step 3: Mark the nearest key level. Prior high/low, session range edge, or round number. Is entry into a level (good) or into empty space (riskier)?
Step 4: Validate stop placement. Is SL beyond the zone? For gold, SL usually $10–$25 away depending on volatility. For EUR/USD, 15–40 pips is common depending on setup and session.
Step 5: Check R:R realism. A 1:2 or 1:3 is ideal. If TP is directly into a major level, consider partial profits.
Step 6: Check news and spreads. If CPI/FOMC/NFP is near, either reduce risk or skip.
Real example using current market context
Suppose we receive: XAUUSD Buy 2652, SL 2640, TP 2676.
- Risk = $12.
- Reward = $24.
- R:R = 1:2.
If your chart shows support around 2648–2652 and price is above a key intraday moving average, this is a “green light” setup. If price is already at 2666 when you see it, you’re late. Your best move is to wait for the retest or skip.
For a deeper “provider selection + filtering” framework, see our checklist: forex trading signals provider checklist for beginners.
Comparison table: minimal vs overloaded technical analysis (signal trader edition)
Most signal traders don’t lose because the signal was “wrong.” They lose because their charting process is too complicated to execute under pressure.
This comparison shows what to focus on.
| Category | Minimal (recommended for signal traders) | Overloaded (common mistake) | Result |
|---|---|---|---|
| Chart setup | Clean candles + key zones + session levels | Multiple oscillators + custom templates + too many lines | Minimal = fast decisions; overloaded = hesitation |
| Trend read | Structure (HH/HL or LH/LL) + one MA | 3–5 moving averages + “trend meters” | Minimal reduces conflicting signals |
| Entry timing | Break/retest or rejection at a zone | Waiting for 6 indicator confirmations | Overloaded often enters late |
| Stop placement | Beyond structure + ATR awareness | Random fixed stops regardless of volatility | Minimal adapts to market conditions |
| Trade management | Partial at 1R, trail under swings | Constantly moving SL based on emotions | Minimal builds consistency |
Stops, targets, and position sizing: the technical side of risk
Signal traders often focus on “entry accuracy.” Professionals focus on risk structure.
Your stop and target are part of the technical setup, not an afterthought. When you understand why SL and TP are placed where they are, you stop second-guessing and start executing.
Gold (XAUUSD) example with realistic SL/TP
Let’s use the current band: gold trading around $2650.
- Entry: 2652
- Stop: 2640 (risk = $12)
- TP1: 2664 (reward = $12, 1R)
- TP2: 2676 (reward = $24, 2R)
- TP3 (aggressive): 2688 (reward = $36, 3R) if structure supports continuation
This is clean, measurable, and aligned with the guideline of a $10–$25 stop on gold depending on volatility.
Forex example with pip math (EUR/USD)
Suppose EUR/USD is 1.0520 and a signal suggests:
- Sell: 1.0520
- SL: 1.0550 (30 pips risk)
- TP: 1.0460 (60 pips reward, 1:2)
Now your job is not to “improve” the trade. Your job is to size it correctly so 30 pips is within your risk limit.
Position sizing in one sentence
Choose a fixed % risk per trade (like 0.5%–2%), then calculate lot size from stop distance.
If you’re risking 1% on a $2,000 account ($20) and your gold stop is $12, your lot size must be small enough that a $12 move equals ~$20 loss. This is where many traders blow up: they keep lot size constant while stops change.
For a complete framework you can apply to every signal, keep this bookmarked: risk management strategies when using forex signals.
Common technical mistakes signal followers make (and how to fix them)
Most losses come from a few repeatable behaviors. Fix these and your results often improve without changing providers.
Mistake #1: Entering late because you “waited for confirmation”
If a signal is designed for a breakout retest, entering after the move already traveled 60% of the distance to TP destroys R:R.
Fix: Decide in advance: either enter at the provided price zone, or wait for the next retest. Don’t chase.
Mistake #2: Moving the stop loss because the level “should hold”
Technical analysis is probabilities, not certainty. A level can break even if it’s “perfect.”
Fix: If SL is hit, it’s information. Log it. Don’t widen it. If you want more room, reduce lot size next time.
Mistake #3: Ignoring higher timeframe resistance/support
Many traders take a buy signal and forget that price is 5 points below a weekly resistance zone. Then they’re shocked when it reverses.
Fix: Always check one higher timeframe level. On gold, look at H4/Daily zones. On FX, at least H1/H4.
Mistake #4: Treating every pair the same
USD/JPY at 149.50 can trend smoothly for hours. Gold at $2650 can whip $8 in minutes. The same stop logic doesn’t apply.
Fix: Use ATR or recent candle size to adapt. Volatility dictates stop distance and position size.
Mistake #5: Overtrading because “signals keep coming”
Even great providers will post multiple opportunities. Your account doesn’t need to take all of them.
Fix: Set a daily loss limit and a max trades per session. Quality beats quantity.
If you want a broader list of execution mistakes (late entries, revenge trades, copying without understanding), read common mistakes traders make while using forex signals.
How to build your “signal trader chart template” (simple and repeatable)
You want a chart template that supports fast decisions. Not a cockpit full of blinking lights.
Here’s a clean setup we recommend for most signal followers trading London and NY sessions.
Step-by-step: build a minimal template
Step 1: Candlesticks + session separators. If your platform supports it, mark Asia/London/NY. This helps you see where breakouts start.
Step 2: Add key levels.
- Prior day high/low
- Asian range high/low
- Weekly high/low (optional)
- Round numbers (especially gold: 2650/2660/2670)
Step 3: Add one moving average. 50 EMA on H1 or H4 is enough for bias.
Step 4: Add ATR (optional but useful). Use it to sanity-check stops, not to “predict” direction.
Step 5: Remove everything else. If it doesn’t help you decide “take/skip/size,” it’s noise.
How to use the template with a real signal
Let’s say you get a GBP/USD signal around 1.2680. Your template tells you:
- Are we above or below the 50 EMA on H1/H4?
- Is 1.2700 a known resistance zone today?
- Did London just sweep the Asian high?
Now you’re not guessing. You’re reading the same story the market is telling everyone else.
Where United Kings fits into this workflow
We provide the trade plan: entry, SL, and multiple TP levels where appropriate. Your template helps you execute that plan with discipline.
If you’re exploring our services, start with our main premium signals page, then choose your focus: gold signals or forex signals.
How to align technical analysis with United Kings signals (a practical workflow)
Let’s turn everything into a real routine you can follow daily.
This workflow is designed for signal traders who want structure without spending hours analyzing charts.
Daily routine (10–15 minutes total)
1) Pre-session prep (5 minutes).
- Mark prior day high/low on XAUUSD and your main FX pairs.
- Mark Asian range if you trade London.
- Check DXY (currently ~106.80) for broad USD tone.
2) When a signal arrives (60 seconds).
- Run the 60-second filter: structure → level → SL logic → R:R → news.
- If you missed entry, don’t chase. Wait for retest or skip.
3) During the trade (2 minutes).
- Set alerts near TP1 and near your invalidation level.
- Don’t stare at the chart. Let the plan work.
4) After the trade (3 minutes).
- Screenshot entry and exit.
- Write one sentence: “Did I follow the plan?”
- Log whether the setup was trend, range, or reversal.
Why this works
It turns technical analysis into a decision system, not entertainment. You’ll stop reacting emotionally to every candle and start thinking in probabilities.
It also makes signals educational. Over time, you’ll notice patterns: which setups work best in London, which in NY, and when gold is in a “trend day” versus a “range day.”
FAQ: Technical analysis for signal traders
Do I need indicators if I’m already using signals?
No, but one or two can help. A single moving average for trend bias and ATR for stop sizing is often enough. The goal is clarity, not complexity.
What timeframe should I use for forex chart analysis when following signals?
Use one higher timeframe for context (H4 or H1) and one execution timeframe (M15 or M5) depending on the signal style. If the signal is a swing trade, prioritize H4/Daily zones.
How do I know if I’m entering too late?
If price has already moved a large portion of the distance to TP (for example, 60%+), your risk-reward is usually damaged. Wait for a retest or skip and protect your consistency.
What’s the best technical analysis approach for gold (XAUUSD) signals?
Focus on session highs/lows, liquidity sweeps, and clean support/resistance zones. Use ATR to adapt stops because gold volatility changes quickly around news and NY session flows.
Can technical analysis help me avoid losses completely?
No. Losses are part of trading. Technical analysis helps you avoid low-quality entries, manage risk better, and execute with discipline—but it cannot eliminate drawdowns.
Risk disclaimer (read before you trade)
Trading forex, gold (XAUUSD), and crypto involves significant risk and may not be suitable for all investors. Signals and analysis are provided for educational purposes and do not constitute investment advice. Past performance is not indicative of future results. You can lose some or all of your capital. If you’re a beginner, we strongly recommend practicing on a demo account before trading live and using strict risk management on every position.
Ready to follow signals with more confidence? Join United Kings
If you want premium Telegram signals with clear Entry, SL, and TP levels—built for London and New York sessions—United Kings is built for you.
We’re proud to support a community of 300K+ active traders and deliver a structured experience: signals plus education, so you’re not just copying trades—you’re improving every week.
- Explore our full offering on United Kings premium trading signals.
- If gold is your main market, start here: XAUUSD gold signals.
- If you trade majors like EUR/USD and GBP/USD, start here: forex signals.
- Review the 2 plans on our pricing page: Monthly ($199/month, cancel anytime) and Lifetime ($499 one-time with FREE ebook).
- Join the live community on United Kings Telegram and see how we manage trades in real time.
Bonus: Every plan includes a 48-hour refund window for access or billing problems (conditions apply—see refund policy).
Signals are powerful. Signals + understanding is unstoppable. If you’re ready to trade smarter, we’ll see you inside.