If you’ve ever watched a “perfect” XAUUSD setup fail for no obvious technical reason, here’s the uncomfortable truth: it often wasn’t your entry. It was the macro filter you didn’t apply.
Right now gold (XAUUSD) is trading around $2650 (+0.35% on the day). The Dollar Index (DXY) is near 106.80, and USD/JPY is around 149.50. This is exactly the kind of environment where correlation cues matter, because gold can trend cleanly for 30–60 minutes… then snap back $15–$25 when the dollar or yields reprice.
This guide is your XAUUSD correlation playbook: a repeatable, rules-based way to confirm or reject gold signals using DXY and the US 10-year Treasury yield (10Y). We’ll use practical thresholds, show when correlations break, and give you a pre-trade checklist you can run in under 60 seconds.
TL;DR: The correlation rules we actually use
- Gold vs DXY is usually inverse: if DXY is trending up with momentum, be cautious with XAUUSD longs.
- Gold vs US 10Y yield is often inverse: rising yields (especially real yields) can pressure gold; falling yields can support rallies.
- Filter rule: only take XAUUSD trades that align with at least 2 out of 3 factors (XAUUSD technicals, DXY direction, 10Y yield direction).
- Threshold idea (practical): if DXY is moving +0.20% intraday and 10Y yield is +4–6 bps, treat XAUUSD longs as “high friction.”
- Correlation breaks around news: CPI/FOMC/NFP can flip relationships for 5–30 minutes; wait for the second move or post-release structure.
- Best use case: correlations help you avoid chop and time entries in London/NY sessions when macro flows dominate.
Why XAUUSD correlation matters more than most traders admit

XAUUSD is not “just another chart.” It’s a macro asset disguised as a trading instrument.
Gold responds to USD strength, rates/yields, risk sentiment, and geopolitics. That means a clean bullish engulfing candle at $2642 can still fail if DXY is breaking higher and the 10Y yield is ripping.
At United Kings, we love technical execution. We also respect the macro tape.
Here’s the practical problem most signal followers face: you get an entry, stop loss, and take profit. You place the trade. Then the market does something “random” and tags your stop by $1–$3 before running to target without you.
Correlation filters reduce those “random” losses because they help you avoid trading against the dominant driver of the moment.
In the current context (XAUUSD ~$2650, DXY 106.80), you should assume the market is sensitive to:
- US data surprises (inflation, jobs, retail sales).
- Rate expectations (Fed cuts pushed out = yields up = gold pressure).
- Safe-haven flows (risk-off can lift USD and gold together, breaking the “inverse” rule).
That last bullet is why we need a playbook, not a simplistic “gold goes opposite dollar” slogan.
If you’re using signals (ours or anyone’s), correlation filters are a force multiplier. If you’re not using signals, they still help you avoid low-quality trades.
And if you want a structured stream of gold setups with clear Entry/SL/TP, our premium channel on United Kings Gold Signals is built around London and NY session opportunities with an 85%+ historical win rate (see /results/ and /methodology/ for how it’s calculated).
Gold vs DXY explained: what the inverse correlation really means
The DXY measures the USD against a basket of major currencies. When DXY rises, USD is strengthening broadly.
Gold is priced in USD. So, mechanically, a stronger dollar often means gold becomes “more expensive” for non-USD buyers, which can reduce demand and push XAUUSD down.
But the real-world relationship is more nuanced. You’ll see three common regimes:
Regime A: Clean inverse (the “textbook” market)
DXY trends up, gold trends down. Or DXY trends down, gold trends up.
This is the best environment for correlation filtering, because it gives you a clear directional bias. For example:
- DXY pushes from 106.60 to 106.95 in the London morning.
- XAUUSD fails to hold $2652 and slips to $2638.
- A sell signal near $2645 with a $12 stop can work smoothly because the macro wind is at your back.
Regime B: Risk-off “both up” (USD and gold rise together)
In panic or high uncertainty, USD and gold can both attract safe-haven flows.
That’s when traders get confused: “DXY is up—why is gold up too?”
In this regime, DXY is not a clean filter. You must look at yields and risk sentiment. If yields are falling while DXY rises (flight to safety into USD cash and Treasuries), gold can rally alongside.
Regime C: Range/chop (correlation becomes noise)
When DXY is flat inside a tight intraday range (say 106.75–106.85), it’s not a meaningful driver.
In that case, gold can move on technical liquidity, session flows, or positioning. Your filter should treat DXY as “neutral,” not “bullish/bearish.”
Actionable takeaway: You don’t need perfect correlation. You need a useful read on whether USD is providing tailwind or headwind.
When our team shares a setup in United Kings Signals, your job as a trader is to check whether the macro tape is likely to support the trade’s direction over the next 30–180 minutes.
Gold vs US 10Y yield: why yields often beat DXY as a filter
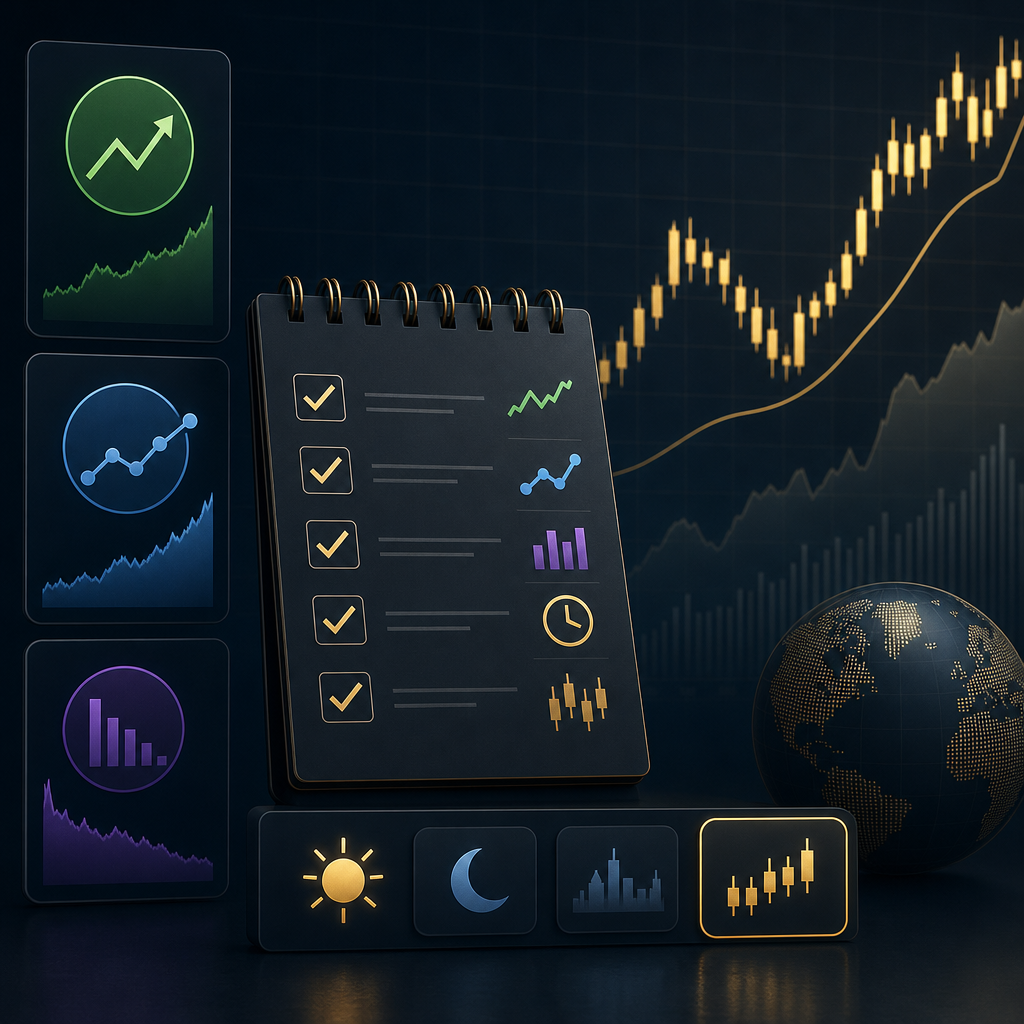
If DXY is the “currency lens,” the US 10Y yield is the “rates lens.” And for gold, rates often matter more.
Gold doesn’t pay interest. So when yields rise, the opportunity cost of holding gold increases. That can pressure XAUUSD, especially when the move is driven by real yields (yields adjusted for inflation expectations).
Here’s the practical way to think about it:
- 10Y yields rising fast = markets pricing tighter policy / fewer cuts / stronger growth = gold headwind.
- 10Y yields falling fast = markets pricing easier policy / weaker growth / more cuts = gold tailwind.
In the current environment, where gold is elevated around $2650, yield sensitivity can be sharp. A +6 bps spike in the 10Y during NY can coincide with a $10–$20 drop in XAUUSD, especially if liquidity is thin or stops are clustered.
Why “bps” matters (and what to watch)
Yields are quoted in percentages, but traders think in basis points (bps). 1 bp = 0.01%.
Intraday, a move of:
- 0–2 bps: usually noise (unless it’s during a breakout).
- 3–5 bps: meaningful, can influence gold direction.
- 6–10 bps: strong impulse, often “overrides” minor technical levels.
Important: yields can move for different reasons. A yield rise from “growth optimism” can be bearish for gold. A yield rise from “inflation fear” can be mixed, because gold is also an inflation hedge narrative-wise.
So we don’t treat yields as a magic on/off switch. We treat them as a probability filter.
If you want a deeper execution framework around sessions, pair this article with our timing guide on the United Kings blog, especially the London/NY overlap material. Our signal style is built for those windows because that’s when yields and DXY often set the day’s direction.
The correlation matrix: when DXY or yields matter most (comparison table)
Not every trading hour is equal. Not every macro driver is dominant. This table is a simple way to decide which filter deserves more weight.
| Market condition | What you’ll often see | DXY usefulness | 10Y yield usefulness | How to trade XAUUSD |
|---|---|---|---|---|
| Trend day (London/NY) | DXY breaks range; yields trend 5–10 bps | High | Very high | Trade with macro; hold runners to TP2/TP3 |
| Range day | DXY flat; yields choppy 0–3 bps | Low | Medium | Focus on liquidity sweeps, mean reversion, smaller targets |
| Risk-off shock | USD up + gold up; equities down | Medium (can mislead) | High (often falling yields) | Wait for structure; buy dips if yields fall and gold holds key levels |
| Hot inflation print | Yields spike; DXY jumps | High | Very high | Avoid early longs; sell rallies until yields stabilize |
| Dovish Fed / weak data | Yields drop; DXY softens | High | Very high | Look for long continuation; buy pullbacks with tight invalidation |
The point isn’t to become a macro economist. The point is to know which external chart is likely to invalidate your gold setup.
If you’re following signals, this is how you stop taking every alert blindly and start taking only the alerts that match the day’s macro regime.
Practical thresholds: the exact numbers to filter XAUUSD signals
Let’s get specific. Correlation is useless if it stays theoretical.
Below are practical thresholds you can use as a pre-trade filter. They’re designed for intraday trading during London and New York sessions, which is where United Kings focuses most of its activity.
1) DXY intraday change thresholds
Use the daily open as your reference. Then check how far DXY has moved from that open.
- 0.00% to ±0.10%: neutral. DXY is not a strong filter.
- ±0.10% to ±0.20%: moderate. Favor trades aligned with DXY direction.
- Beyond ±0.20%: strong impulse day. Avoid fighting the move unless you have a news-driven reversal setup.
Example: If DXY is up +0.25% on the day and still making higher highs, treat XAUUSD longs as lower probability unless yields are falling hard and gold is in a clear risk-off bid.
2) US 10Y yield intraday move thresholds (bps)
Use the prior session close or the day’s open. Then measure the move in bps.
- 0–2 bps: noise. Don’t over-filter.
- 3–5 bps: meaningful. Use as confirmation.
- 6–10 bps: dominant driver. Expect gold to respect yield direction.
Example: If 10Y yields are up +7 bps from the open during NY, be cautious buying gold breakouts above $2660. Those breakouts often fail into stops.
3) “Alignment score” (simple 0–3 framework)
Give each factor a point if it supports your trade direction:
- XAUUSD technical structure supports the trade (trend/level/liquidity).
- DXY direction supports the trade (inverse relationship most days).
- 10Y yield direction supports the trade (inverse relationship most days).
Rule: take the trade when you have 2 or 3 points. Reduce size or skip when you have 0 or 1 point.
This is the single simplest way to avoid low-quality trades without overthinking correlation coefficients.
And if you’re new to signals, pair this article with our risk framework: risk management strategies when using forex signals. Correlation filters help, but position sizing keeps you alive.
Step-by-step: the 60-second pre-trade checklist (repeatable)
Here’s the exact process we recommend before you place an XAUUSD trade—especially if you’re taking a signal from Telegram.
Do it in order. Keep it fast. The goal is clarity, not analysis paralysis.
Step 1: Identify the trade type (breakout vs reversal)
- Breakout trade: you’re expecting continuation through a level (e.g., $2662 breaks and runs).
- Reversal trade: you’re fading an extreme (e.g., sweep below $2630 then reclaim).
Breakouts need macro alignment more than reversals. Reversals can work against macro, but only with strong liquidity/structure confirmation.
Step 2: Check DXY direction and impulse
- Is DXY trending (higher highs/lows) or ranging?
- Is DXY beyond ±0.20% from the open?
If DXY is trending strongly, assume it will “bully” gold unless yields disagree.
Step 3: Check 10Y yield direction and speed
- Is the 10Y up or down on the session?
- Is it moving 6–10 bps (impulse) or 0–2 bps (noise)?
Fast yield moves often precede gold moves by minutes, not hours. That’s why this filter is powerful for timing.
Step 4: Map your invalidation (SL) to a real level
Gold stops should not be “random.” In the $2610–$2690 zone, a typical intraday stop is $10–$25 depending on volatility.
Example long: Entry $2642, SL $2629 (risk $13). Then TP1 $2668 (reward $26, 1:2), TP2 $2681 (reward $39, 1:3).
If DXY/yields are against you, tighten risk or skip. Don’t widen the stop to “give it room.”
Step 5: Decide the execution plan (market vs limit)
- Trend-aligned: market entry can be fine on a retest.
- Trend-opposed: prefer limit entries at premium/discount zones with tight invalidation.
This is how you avoid getting slipped into the worst possible price during a macro impulse.
If you want to build discipline around this process, our educational posts and signal formatting are designed to be followed systematically. Start with our forex signals Telegram beginner guide (it applies to gold too), then apply this correlation filter on every trade.
Worked examples at current prices: accept vs reject gold signals
Let’s turn the rules into real scenarios using current market context: XAUUSD ~$2650, DXY 106.80.
These examples show how correlation filters protect you from “technically valid” but macro-hostile trades.
Example A: Accept a long (macro tailwind)
Setup: XAUUSD sweeps below $2638 during London, then reclaims $2642 with strong bullish candles.
Macro check:
- DXY is down on the session (e.g., 106.90 → 106.75, roughly -0.14%).
- 10Y yields are down 5 bps (risk-off / dovish repricing).
Trade plan: Buy $2642, SL $2629 (risk $13). TP1 $2668 (1:2), TP2 $2681 (1:3).
Why it’s high quality: You have 3/3 alignment: bullish gold structure, weaker USD, falling yields.
Example B: Reject a long (macro headwind)
Setup: XAUUSD breaks above $2660 in NY open, looks like a clean continuation.
Macro check:
- DXY is up +0.22% on the day and making new highs.
- 10Y yields are up +7 bps and accelerating.
Decision: Reject the long or reduce size dramatically. Wait for a pullback or a yield stabilization.
What often happens: Gold spikes to $2663–$2665, then dumps to $2648 (a $15 flush) as yields reprice. That flush is where breakout buyers get stopped.
Example C: Accept a short (macro confirmation)
Setup: XAUUSD fails at $2662 twice, forms lower highs, then breaks below $2654.
Macro check:
- DXY is firm and trending higher (106.70 → 106.90).
- 10Y yields are up +4 bps (not huge, but supportive).
Trade plan: Sell $2652, SL $2666 (risk $14). TP1 $2624 (reward $28, 1:2), TP2 $2610 (reward $42, 1:3).
Why it works: Even if gold bounces $6–$8 intraday, the macro headwind increases the probability of continuation lower.
Example D: “Gray zone” (trade smaller or wait)
Setup: Gold gives a clean short signal at $2656.
Macro check:
- DXY is flat inside a 0.08% range (neutral).
- 10Y yields are down 3 bps (slight tailwind for gold).
Decision: Either skip, wait for confirmation, or trade smaller with faster profit-taking. This is where chop lives.
These examples are exactly why correlation filtering improves results for signal followers. It doesn’t create more trades. It creates better trades.
When correlations break down (and how to avoid getting trapped)
Correlation is not a law. It’s a tendency.
Professional traders respect correlation until the market gives a reason not to. Here are the most common “breakdown” moments and what to do.
1) Major news releases (CPI, FOMC, NFP)
During the first 1–5 minutes after a high-impact release, gold can move violently in both directions.
DXY and yields can also whipsaw. That creates a temporary environment where correlation signals are unreliable.
Survival rule: don’t use correlation filters in the first impulse. Use them on the second move after structure forms.
If you trade news, combine this with our event framework: how gold signals react to unexpected news events.
2) Risk-off shocks (USD up + gold up)
Geopolitical headlines, banking stress, or sudden equity selloffs can push both USD and gold higher.
In that case:
- DXY rising does not automatically mean sell gold.
- Check yields: if yields are falling while DXY rises, gold can rally strongly.
Rule: in risk-off, give yields more weight than DXY.
3) Real yield vs nominal yield confusion
Sometimes nominal yields rise because inflation expectations rise faster. That can keep real yields stable, and gold may not fall as expected.
You don’t need to calculate real yields intraday, but you should be aware: if gold is not reacting to rising nominal yields, the market may be treating the move as inflationary, not hawkish.
4) Positioning and month-end flows
At month-end or around major rebalancing windows, flows can dominate fundamentals for a few hours.
That’s when you’ll see “why is gold moving with no reason?” moves. Correlation can look broken because flows are not macro-driven.
Rule: reduce size and demand clearer technical confirmation. If you’re unsure, wait for London/NY overlap liquidity.
Correlation breakdowns are not a reason to ignore macro. They’re a reason to treat macro as a context tool, not a rigid system.
How to integrate correlation filters with gold signals (without overthinking)
If you use a signal provider, your biggest edge is speed and clarity. Your biggest risk is blindly taking everything.
The goal is not to turn every trade into a dissertation. The goal is to add a simple approval layer that keeps you aligned with the day’s drivers.
The “Signal + Filter + Execution” model
- Signal: Entry, SL, TP levels from a trusted provider.
- Filter: DXY and 10Y yield alignment score (0–3).
- Execution: choose order type, sizing, and management rules.
Here’s how it looks in real life:
You receive a gold signal: Buy XAUUSD 2646, SL 2633, TP 2672 / 2685.
Before you place it, you check:
- DXY is down -0.18% (good for long gold).
- 10Y yield is down -4 bps (good for long gold).
You take it with confidence and manage it like a professional, not like a gambler.
Now flip it:
You receive: Buy XAUUSD 2658, SL 2646, TP 2682.
But you see:
- DXY is up +0.24% and breaking highs.
- 10Y yield is up +8 bps.
That’s a “no” or “small size only” trade. You just avoided the most common way signal followers lose: trading a good setup on a bad day.
If you’re still choosing a provider, use our due diligence guide: forex trading signals provider checklist. Correlation filters help, but provider quality matters first.
And if you want a premium channel built around clear levels and London/NY execution, explore United Kings Gold Signals (and for FX pairs, United Kings Forex Signals).
Session timing: why London and New York make correlation filters stronger
Correlation filters work best when the macro drivers are actually moving. That’s usually during London and New York.
During Asia, gold can still move, but it’s often more technical and liquidity-driven. DXY and yields may be quieter, and spreads can be less favorable depending on your broker.
London session: the “set the tone” window
London often establishes the day’s directional bias.
If DXY breaks a key level during London (for example, 106.70 → 106.90), gold frequently responds with a sustained move rather than a quick spike.
How to use it:
- Wait for the first 30–60 minutes to see whether DXY and yields trend or chop.
- Then take XAUUSD signals that align with that tone.
New York session: the “rates reprice” window
New York is where yields can really start moving, especially around US data releases and Treasury auctions.
It’s common to see gold whip $10–$20 in minutes if the 10Y yield jumps 6–10 bps.
How to use it:
- Be cautious taking fresh trades right before major data.
- After the release, wait for the yield direction to stabilize, then trade the continuation.
London/NY overlap: the highest signal-to-noise period
This is where volume and participation are highest.
Correlation tends to “behave” because macro flows are active and liquidity is deep enough to sustain trends.
This is also why United Kings emphasizes these sessions in our Telegram workflow. If you want to see our real-time trade formatting and education, join our Telegram community at United Kings Telegram channel.
Risk management for correlation-based trading (position sizing rules)
Correlation filters improve trade selection. They do not eliminate losses.
So we need rules that keep a single bad day from becoming a blown account.
Rule 1: Risk a fixed percentage, not a fixed dollar amount
Most retail traders do the opposite. They keep the same lot size and “hope.”
A better approach:
- Risk 0.5%–1% per trade if you’re consistent.
- Risk 0.25%–0.5% if you’re newer or trading around news.
Rule 2: Adjust size based on alignment score
Remember the 0–3 alignment model?
- 3/3 alignment: normal size (your standard risk).
- 2/3 alignment: normal or slightly reduced size.
- 1/3 alignment: half size or skip.
- 0/3 alignment: skip.
This single rule can dramatically reduce overtrading.
Rule 3: Keep gold stops realistic for volatility
At $2650, gold can move $5 in seconds and $15–$25 in a session impulse.
Common intraday stop logic:
- Tight scalp: $8–$12 (only if structure is tight and spreads are stable).
- Standard intraday: $12–$18.
- Volatile/news: $18–$25 or don’t trade.
Stops should sit beyond a real invalidation: a swing low/high, a liquidity sweep level, or a structural break.
Rule 4: Take partial profits at 1:2 when macro is uncertain
If DXY is neutral but yields are supportive, or vice versa, consider taking partials at 1:2 and letting the rest run only if macro confirms.
If you want a complete framework for managing signal trades, bookmark our risk management guide and apply the same rules to XAUUSD.
Advanced notes: correlation tools, indicators, and common mistakes
Once you have the basic playbook, you can add a few advanced tools—but only if they simplify decisions.
Tool 1: Rolling correlation (use it as a warning, not a trigger)
Some platforms let you compute rolling correlation between XAUUSD and DXY or yields.
This can help you detect regime shifts. If correlation flips from strongly negative to near zero, your filter should rely more on price action and less on macro.
But: correlation is backward-looking. Don’t use it to “predict” the next candle.
Tool 2: Rate expectations proxies
Traders often watch Fed Funds futures or 2Y yields for rate expectations. If you only want one yield chart, the 10Y is fine. But the 2Y can sometimes lead gold on Fed repricing days.
If 2Y and 10Y move together aggressively, treat it as a high-conviction rates day.
Common mistake #1: Treating DXY as a perfect inverse switch
We covered the risk-off “both up” regime. Another issue is that DXY can rise due to EUR weakness even if US rates are stable. That can create a weaker gold reaction.
So you must always ask: Is USD strong because of US rates, or because other currencies are weak?
Common mistake #2: Ignoring timing and liquidity
A correlation filter can be “right,” but your entry can still be late.
If yields spiked 20 minutes ago and gold already dropped $18, selling at the low is not a strategy. Wait for a pullback into resistance (e.g., reclaim/fail at $2652–$2656) and then take the signal.
Common mistake #3: Widening SL because “macro agrees”
Macro alignment increases probability, not certainty.
Keep your SL based on structure. If structure requires a $30 stop, that’s not an intraday trade. That’s either a swing idea or a skip.
If you want a consistent stream of structured ideas with clear invalidations, that’s exactly what we publish in United Kings Signals—and we explain the reasoning so you learn while you trade.
FAQ: XAUUSD correlation, gold vs DXY, and gold vs US 10Y yield
1) Is gold always negatively correlated with DXY?
No. It’s often inverse, but risk-off regimes can push both higher. Use DXY as a filter, not a rule.
2) Which is the better filter for gold: DXY or US 10Y yields?
For intraday gold, US 10Y yields often matter more, especially on US data days. DXY is still useful, particularly when USD strength is broad and trending.
3) What thresholds should I use to avoid bad XAUUSD trades?
A practical starting point: avoid gold longs when DXY is +0.20% or more on the day and 10Y yields are +6 bps or more. Do the opposite for shorts on strong downside days.
4) Do correlation filters work for scalping?
Yes, but they work best for scalps taken during London/NY when DXY and yields are actually moving. In slow markets, correlation adds less value.
5) I follow gold signals—should I skip trades when macro disagrees?
Either skip or reduce size. The best approach is the 2-out-of-3 alignment rule (gold structure + DXY + yields). It keeps you selective without becoming paralyzed.
Risk disclaimer (read before trading)
Forex and gold trading involve significant risk and may not be suitable for all investors. You can lose more than your initial deposit if trading with leverage. Past performance (including any stated historical win rate) does not guarantee future results. Signals and educational content are provided for informational purposes only and are not financial advice. If you’re a beginner, practice first on a demo account and use strict risk management.
Join United Kings: get premium XAUUSD signals + macro-ready execution
If you want to stop guessing and start trading XAUUSD with structure, timing, and discipline, join United Kings.
We deliver premium Telegram signals for gold and major FX pairs with clear Entry, SL, and TP levels, designed around London and New York sessions. You also get educational breakdowns so you understand the “why,” not just the “what.”
- Explore our full service: United Kings Signals
- Focused gold stream: United Kings Gold Signals
- Forex pairs stream: United Kings Forex Signals
Choose a plan on our pricing page:
- Starter (3 Months): $299 (~$100/mo)
- Best Value (1 Year): $599 ($50/mo) + FREE ebook (50% savings)
- Unlimited (Lifetime): $499 (pay once)
And if you want the fastest access, join our Telegram now: United Kings on Telegram.
Note: We offer a 48-hour refund window (conditions apply—see /refund-policy/).