
Ever taken a perfect-looking XAUUSD signal… only to watch gold fake out by $12 and stop you out?
Most traders blame “manipulation” or “bad luck.”
In reality, a big chunk of those losses happen because the macro tape didn’t agree with the chart.
Right now, gold (XAUUSD) is trading around $2650 (+0.35% in 24h). The Dollar Index (DXY) is ~106.80, and USD/JPY is ~149.50. When DXY and US10Y yields start pushing, gold can move like it’s on a different planet.
This guide is your XAUUSD correlation playbook—how to use gold vs DXY and gold vs US10Y yields as a filter to confirm or reject gold signals before you risk a single dollar.
TL;DR (Save this before you trade)
- Gold vs DXY is usually inverse: when DXY rises, gold often struggles; when DXY drops, gold finds fuel.
- Gold vs US10Y yields is usually inverse (especially real yields): rising yields can cap rallies and trigger selloffs.
- Correlation is regime-based: risk-on/risk-off shifts can flip what “normally” works for a few hours or days.
- Use a 3-step checklist: (1) DXY bias, (2) US10Y yield impulse, (3) XAUUSD price action confirmation.
- Correlation filters reduce false breakouts: they help you avoid buying into a macro headwind or selling into a macro tailwind.
- Best results appear in London + NY sessions, when DXY and yields actually move with liquidity.
1) Why XAUUSD Correlation Matters (and why it breaks traders)
Gold is not “just another chart.”
XAUUSD is a global macro instrument that reacts to the dollar, yields, inflation expectations, and risk sentiment—often before retail traders realize what changed.
At $2650, gold is in a zone where $10–$25 swings can happen quickly during London and New York. That’s exactly the distance most traders place stops for intraday XAUUSD trades.
So if you’re ignoring DXY and US10Y yields, you’re basically trading with noise-cancelling headphones in a fire alarm test.
The hidden reason “good” setups fail
Here’s the common scenario.
You spot a clean breakout above $2662. Price retests, wicks look supportive, and you buy at $2663 with a $15 stop at $2648.
Five minutes later, DXY spikes from 106.75 to 106.92 and US10Y yields pop. Gold drops $18 in a straight line, tags your stop, then later recovers.
The chart wasn’t wrong. The timing was wrong because the macro tape was against you.
Correlation is not a “signal”—it’s a filter
This is the mindset shift that changes everything.
We don’t use DXY and yields to predict the exact tick. We use them to answer one question:
“Is this gold signal aligned with the forces that usually move gold today?”
When the answer is yes, you can trade with more confidence, tighter execution rules, and cleaner holds to TP.
When the answer is no, you either skip, reduce risk, or demand stronger confirmation.
Why this matters for signal traders specifically
If you trade premium signals, your edge is consistency.
But even the best signal can get clipped by a correlation headwind. That’s why professional signal execution isn’t only “entry/SL/TP.” It’s also context.
At United Kings, we focus heavily on London and NY session conditions because that’s when DXY and yields provide meaningful confirmation. If you’re building a routine around signals, correlation is one of the best “pre-trade checks” you can add.
If you’re new to choosing providers, our beginner-friendly checklist can help you evaluate quality and transparency: forex trading signals provider checklist.
2) The Core Relationships: Gold vs DXY and Gold vs US10Y Yields
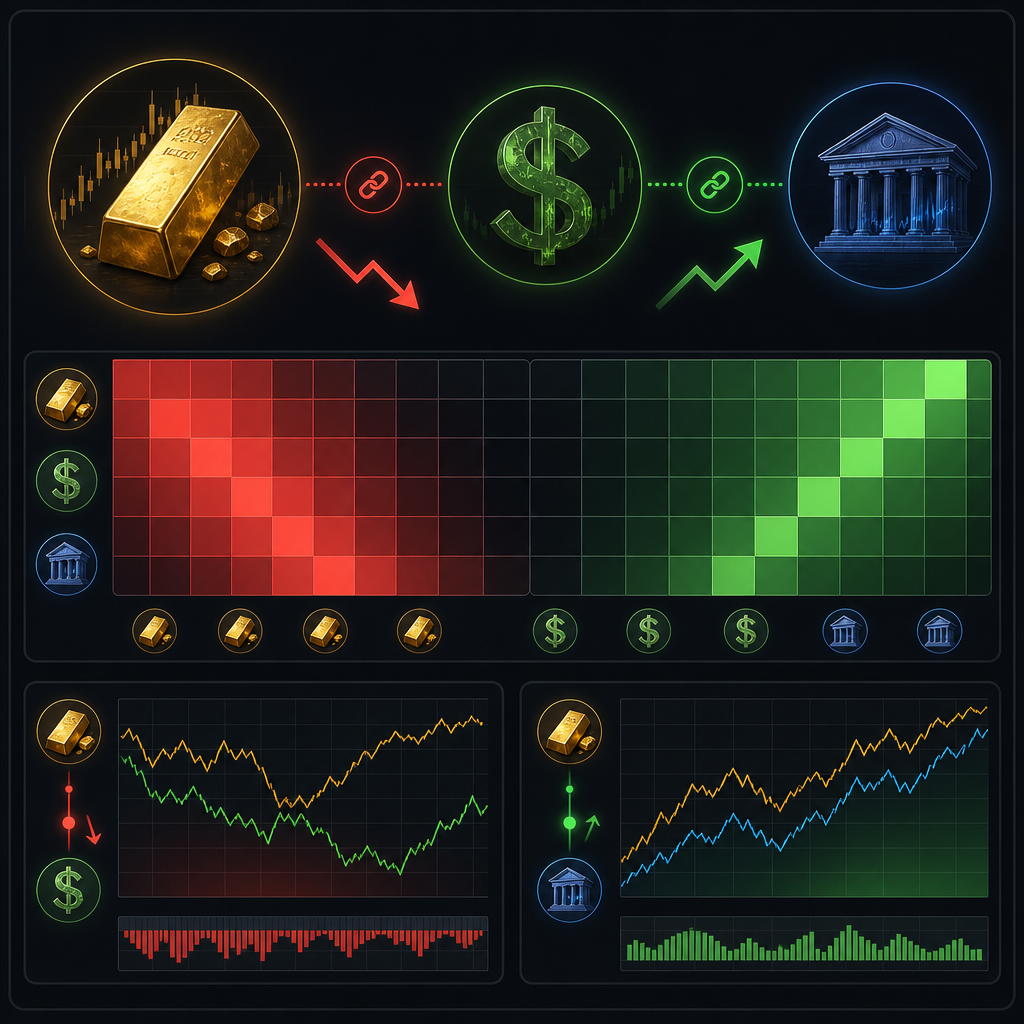
Let’s define the two relationships you’ll use most often.
Not as theory. As actionable trading logic.
Gold vs DXY: the pricing currency effect
Gold is priced in USD globally.
When the dollar strengthens (DXY up), it takes fewer dollars to buy the same ounce of gold—so gold often faces downward pressure.
When the dollar weakens (DXY down), gold often gets a tailwind.
With DXY around 106.80 right now, even a small intraday push (like 106.80 → 107.10) can be enough to stall a gold rally by $10–$20.
Gold vs US10Y yields: the opportunity cost effect
Gold doesn’t pay interest.
So when US Treasury yields rise, the “opportunity cost” of holding gold increases. Investors can earn more by holding bonds, so gold can soften.
When yields fall, gold can shine because the opportunity cost drops.
Traders often say “gold is inverse to yields,” but the more accurate version is:
- Gold is most sensitive to real yields (nominal yields minus inflation expectations).
- Intraday, nominal US10Y yields still matter because they drive flows and USD sentiment.
When both DXY and yields align, gold moves cleaner
Think of DXY and US10Y as two engines.
If both engines push in the same direction, gold often trends more smoothly. If one engine pushes and the other pulls, gold can chop and fake out.
Example:
- Bearish gold environment: DXY rising + US10Y yields rising → rallies in XAUUSD often sell off.
- Bullish gold environment: DXY falling + US10Y yields falling → dips in XAUUSD often get bought.
Quick comparison table: what each driver “does” to gold
| Driver | What it represents | Typical impact on XAUUSD | Best way to use it |
|---|---|---|---|
| DXY (Dollar Index) | USD strength vs basket of majors | Usually inverse: DXY up → gold down | Trend/bias filter for gold signals |
| US10Y Yield | Bond market’s rate expectations | Usually inverse: yields up → gold down | Impulse filter (risk of sharp reversals) |
| DXY + US10Y together | Macro alignment or conflict | Alignment → cleaner trends; conflict → chop | Decide: trade, reduce size, or skip |
If you want a broader foundation on executing signals like a pro (entries, slippage, and timing), pair this with our execution-focused guides inside United Kings blog.
3) Correlation “Regimes”: Risk-On vs Risk-Off Rules (and when correlations flip)
The biggest mistake is treating correlation like a fixed law.
Correlation is a regime. It behaves differently depending on what the market is obsessed with today.
Regime A: Classic “USD + yields drive gold” (most common)
This is the environment most traders recognize.
Gold trades like a macro asset reacting to dollar strength and the cost of money.
- DXY up and US10Y up → gold tends to drift lower or dump on failed breakouts.
- DXY down and US10Y down → gold tends to trend higher and respect support.
In this regime, your correlation filter is highly reliable.
If you’re trading XAUUSD around $2650, you can often “pre-avoid” the worst fakeouts by checking whether DXY and yields are pushing against your direction.
Regime B: Risk-off panic (gold can rise even if USD rises)
In true risk-off, money rushes into safe havens.
Sometimes that means USD up and gold up at the same time.
This is where traders get confused and start over-filtering.
In this regime, your rule becomes:
- Gold can ignore DXY if safe-haven demand is dominant.
- Yields often fall as funds move into bonds, which supports gold.
So you’ll often see: DXY up, US10Y down, gold up.
That’s not “broken correlation.” That’s a different driver taking control.
Regime C: Inflation shock (gold and yields can rise together)
When inflation expectations surge, yields may rise because markets price higher rates.
Gold can also rise as an inflation hedge.
So you can see gold up and yields up together—especially if the market believes inflation will stay sticky.
In this regime, DXY becomes the tie-breaker:
- If yields up but DXY down → gold often still holds up.
- If yields up and DXY up → gold rallies are more likely to fail.
Regime D: “Fed pivot” fantasy (gold rallies on falling yields)
This one shows up around key data and FOMC messaging.
If traders believe the Fed will cut sooner, yields drop, and gold often rallies aggressively.
Even small yield dips can create big gold moves because positioning is crowded.
This is why, around major events, you should also understand how signals behave under surprise volatility. Keep this in your bookmarks: how gold signals react to unexpected news events.
4) The 3-Step Checklist to Filter XAUUSD Signals (DXY + US10Y + Price)
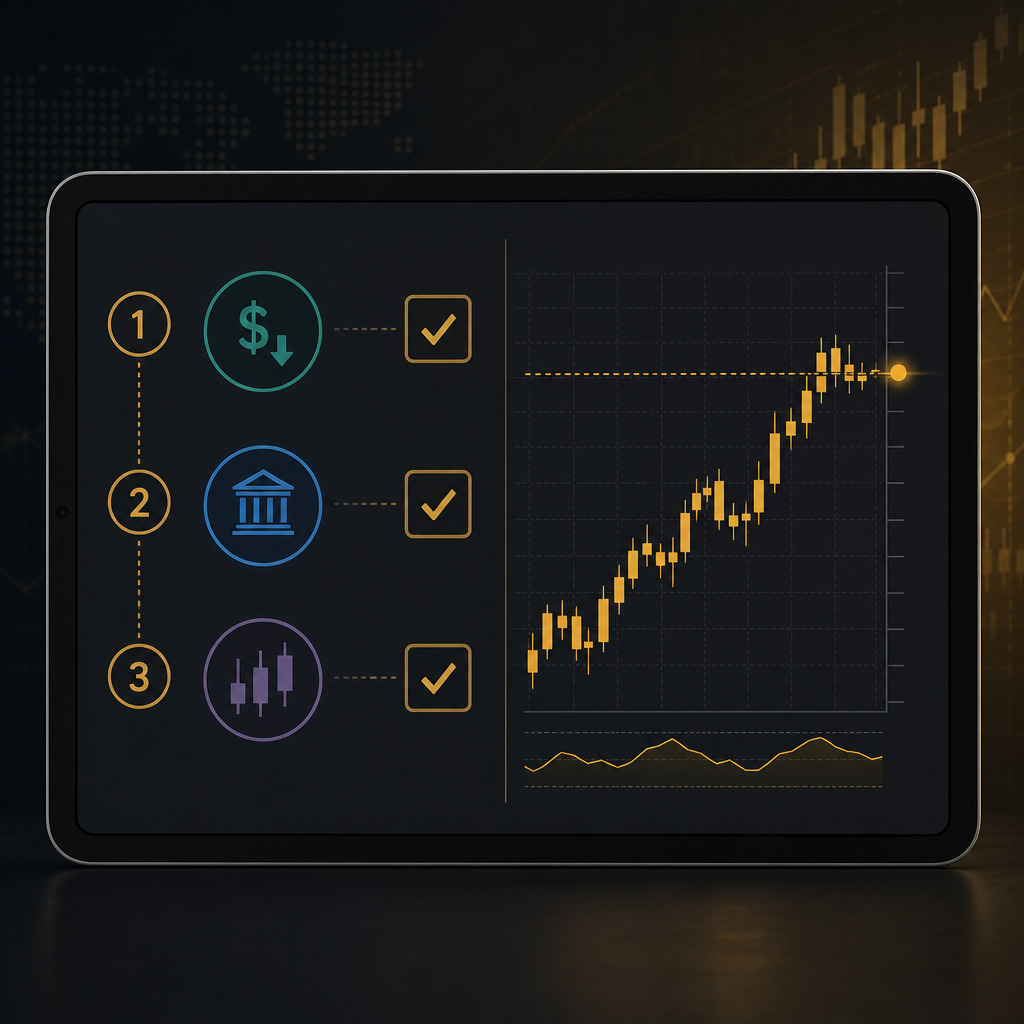
This is the practical part.
You’re about to take a gold signal around $2650. Before you enter, run this 3-step checklist. It takes 60 seconds once you practice it.
Step 1: Check DXY direction and structure (Bias Filter)
You’re not trying to forecast DXY. You’re checking if it’s trending or reversing.
- Bullish DXY bias: higher highs/higher lows on 15m–1h, strong candles, clean breakouts.
- Bearish DXY bias: lower highs/lower lows, breakdowns, weak bounces.
- Neutral: tight range, whipsaws, no follow-through.
Rule: If your gold signal is a BUY, you want DXY neutral-to-bearish. If your gold signal is a SELL, you want DXY neutral-to-bullish.
With DXY around 106.80, a push above 107.00 during NY can be enough to pressure gold intraday.
Step 2: Check US10Y yields for impulse (Volatility Filter)
Yields don’t need to trend all day to matter.
What kills gold trades is a sudden yield impulse that changes risk appetite in minutes.
- Rising yield impulse: sharp spike candles, quick break of intraday highs.
- Falling yield impulse: sharp drop, break of intraday lows.
Rule: Don’t buy gold into a rising yield impulse. Don’t sell gold into a falling yield impulse.
If yields are flat, treat them as “no veto.” If they’re impulsive, treat them as a veto unless price action is extremely strong.
Step 3: Confirm on XAUUSD with price action (Execution Filter)
Correlation only tells you whether the wind is at your back.
You still need a boat.
Confirm with simple, repeatable price action:
- Break + hold: candle closes above resistance (for buys) or below support (for sells).
- Retest acceptance: price retests the level and holds with small wicks.
- Displacement: one or two strong candles show real participation (not a slow grind).
The decision rule (trade, reduce, or skip)
- Trade normally: DXY + yields align with your direction and XAUUSD confirms.
- Reduce risk: one confirms, one is neutral, and XAUUSD confirms strongly.
- Skip: DXY and yields both oppose your direction, or yields are impulsive against you.
For risk sizing rules that keep you alive through volatility, use this as your framework: risk management strategies when using forex signals.
5) Practical Scenarios Around $2650: Avoiding False Breakouts and Bad Fills
Let’s make this real with scenarios using current market context.
We’ll use gold prices in the $2610–$2690 range and realistic intraday stops of $10–$25.
Scenario A: The “Buy breakout” that should be rejected
Setup: XAUUSD breaks above $2660 and prints $2664.
You get tempted to buy the continuation.
Macro check: DXY is rising from 106.78 to 106.95. US10Y yields are also spiking.
What usually happens: Gold struggles to hold above $2660. The breakout becomes a wick. Price dumps to $2648–$2645.
Trade management lesson: If you insist on taking it, you must demand stronger confirmation (close-and-hold above $2660 + retest acceptance) or reduce size.
Better decision: Skip the buy. Wait for either (1) DXY to stall, or (2) gold to reclaim and hold $2660 after the macro impulse cools.
Scenario B: The “Sell the rally” that becomes high-probability
Setup: Gold rallies into resistance at $2672–$2675.
Macro check: DXY is firm above 106.80 and pushing. US10Y yields are ticking higher.
Execution: You sell at $2672 with a $18 stop at $2690 (above the swing).
Targets (1:2 to 1:3):
- TP1 (1:2): $2672 − (2 × 18) = $2636
- TP2 (1:3): $2672 − (3 × 18) = $2618
Why it works: You’re not “guessing” the top. You’re aligning a technical level with a macro headwind for gold.
Scenario C: The “Correlation conflict” chop zone (best to reduce size)
Setup: Gold is at $2650, ranging $2642–$2662.
DXY is falling slightly, but US10Y yields are rising.
This is a classic conflict regime.
How it trades: Gold pops $8–$12, then fades. It breaks a level by $2–$4, then snaps back.
Best play:
- Either wait for alignment (DXY and yields both confirm), or
- Trade smaller size and take quicker profits (scalp logic).
Scenario D: Risk-off day where gold ignores DXY
Setup: Headlines hit (geopolitics or sudden risk event). Equities drop.
DXY rises (safe-haven USD bid), but US10Y yields fall (bond bid).
Gold pushes from $2648 to $2678 despite DXY strength.
Interpretation: Safe-haven demand is dominating. Your filter adapts: yields falling + risk-off tone = gold supported.
Execution tip: Trade price action first, and use DXY as a “soft” filter, not a veto.
6) How to Read DXY Like a Gold Trader (without overcomplicating it)
You don’t need to become a DXY specialist.
You need a simple method to decide whether DXY is supportive, neutral, or hostile for your gold trade.
Use two timeframes: 1H for bias, 5–15m for timing
On the 1H chart, ask:
- Is DXY making higher highs and higher lows?
- Is it compressing into a range?
- Did it just break a key intraday level?
On the 5–15m chart, ask:
- Is there an impulsive candle that changes the tone?
- Are pullbacks shallow (strong trend) or deep (weak trend)?
Three DXY states you can label in seconds
1) Trending: clean structure, follow-through after breaks.
2) Ranging: repeated rejections, no follow-through.
3) Reversing: break of structure + strong counter candles.
For signal filtering, trending matters most.
If DXY is trending up, you need extra evidence before buying gold. If DXY is trending down, you need extra evidence before selling gold.
Practical “veto levels” concept (simple but powerful)
Pick one intraday level on DXY.
For example, if DXY is sitting at 106.80:
- If DXY breaks and holds above 106.95–107.00, treat that as a headwind for gold buys.
- If DXY breaks and holds below 106.65–106.70, treat that as a tailwind for gold buys.
You don’t need exact numbers every day. You need a line in the sand that tells you when USD strength is real.
Don’t confuse EUR/USD with DXY (but use it as a clue)
EUR/USD at 1.0520 matters because the euro is a big component of DXY.
If EUR/USD is dumping, DXY often rises. That can pressure gold.
But DXY is broader than EUR/USD, so treat EUR/USD as a clue, not a replacement.
If you trade majors alongside gold, you can diversify your session plan with our forex signals while keeping correlation logic consistent.
7) How to Read US10Y Yields for Gold Signals (Impulse, Not Prediction)
Most retail traders avoid yields because they look “institutional.”
But for gold, yields are one of the cleanest macro tells—especially around US data.
Focus on slope and speed, not the absolute number
Gold reacts to changes in yields more than the yield level itself intraday.
So instead of asking, “Are yields high?” ask:
- Are yields rising fast right now?
- Are yields breaking an intraday high/low?
- Did yields reverse sharply on news?
What a “yield impulse” looks like in gold
When yields spike, gold often prints:
- A fast $6–$12 drop in 1–3 candles on M5
- Break of a micro support level (like $2652 → $2646)
- A cascade as stops get hit
This is why correlation filtering improves win-rate consistency: it keeps you from taking trades right as the impulse begins.
Yield behavior across sessions
Asia: yields can be quieter; correlation signals are weaker.
London: yields start to matter more as Europe positions for US data.
New York: yields can move sharply on releases and Fed speakers.
United Kings focuses on London and NY session trading because that’s where you get the best combination of liquidity and follow-through. If you want a structured session plan, explore our signal hub: United Kings signals.
Common trap: yields up, gold up… then the rug pull
Sometimes gold holds up even as yields rise.
That doesn’t mean yields “don’t matter.” It may mean gold is lagging and about to reprice.
When you see that divergence, tighten your rules:
- Wait for a clean close above resistance before buying.
- Or, if you’re long, trail aggressively and take partials faster.
8) Building Correlation Rules into Your Gold Signal Execution (Entry, SL, TP)
A correlation filter is only useful if it changes what you do.
So let’s translate the checklist into execution rules you can apply to real signals.
Rule 1: Align direction, then choose the entry style
When DXY and yields support your trade, you can use more “assertive” entries.
- Aligned macro + bullish gold: buy breakout and retest (more confidence).
- Aligned macro + bearish gold: sell rally into resistance (more confidence).
When macro is mixed, you use “defensive” entries:
- Wait for deeper pullbacks.
- Demand stronger closes.
- Trade smaller size.
Rule 2: Place stops where correlation invalidation makes sense
For intraday gold, stops are often $10–$25.
But your stop should also reflect what would prove you wrong in the macro context.
Example buy:
- Entry: $2648 (support bounce)
- Stop: $2635 (−$13)
- TP: $2674 (1:2) or $2687 (1:3)
If DXY suddenly breaks higher and yields spike, you don’t “hope.” You respect the stop because the macro invalidation is happening.
Rule 3: Use correlation to decide whether to hold for TP2/TP3
Many traders take TP1 and then give back the rest.
Correlation helps you decide whether continuation is likely.
- If gold is rising and DXY is falling while yields are falling, holding for TP2 is more justified.
- If gold is rising but DXY starts basing and turning up, consider taking profits earlier.
Rule 4: Don’t let correlation become analysis paralysis
We’re filtering, not forecasting.
If you find yourself watching 10 macro charts, you’re doing it wrong.
Keep it to:
- DXY (15m/1H)
- US10Y yields (15m/1H)
- XAUUSD execution timeframe (5m/15m)
If you want to tighten your execution mechanics around Telegram-based trade calls, this guide is a strong companion: forex signals on Telegram for beginners.
9) Advanced Filters: Divergences, “Correlation Windows,” and News Spikes
Once you master the basic checklist, these advanced filters help you avoid the nastiest days.
Divergence filter: when gold stops following the driver
Divergence is when the driver moves, but gold doesn’t respond.
That’s often a warning that gold is “loaded” for a delayed move.
Examples:
- DXY pushes up strongly, gold barely drops → gold may be supported (risk-off) or it may be lagging before a dump.
- Yields drop sharply, gold doesn’t rally → gold may be capped by technical resistance.
How to trade it: reduce size, tighten confirmation rules, and avoid chasing breakouts.
Correlation windows: when the relationship is strongest
Correlation isn’t equally strong all day.
It’s strongest during:
- London open (first 60–90 minutes)
- NY open (first 60 minutes)
- Major US data windows (CPI, PPI, NFP, retail sales)
- Fed speaker windows (especially when markets are sensitive)
It’s weaker during illiquid drifts where gold can move on technicals alone.
News spike rule: the first move can be a trap
During high-impact releases, the first 1–3 minutes can be chaos.
DXY and yields can whip in both directions, and gold can print a $20 candle.
Practical rule: If you’re not already in the trade, wait for:
- the first spike,
- the first retrace,
- then re-evaluate with the checklist.
This single habit can save you multiple stopouts per month.
Cross-check with USD/JPY as a risk proxy
USD/JPY at 149.50 is a useful “rates sentiment” proxy.
When USD/JPY is ripping higher, it often reflects USD strength and/or yield support—both can be bearish for gold.
When USD/JPY is dumping, it often aligns with falling yields, which can support gold.
It’s not a primary filter, but it’s a helpful clue when DXY is messy.
10) A Simple Daily Routine for London + NY Using the Correlation Playbook
Consistency comes from process.
Here’s a routine you can use daily, even if you only trade 1–2 signals.
Pre-London (10 minutes)
- Mark XAUUSD key levels: yesterday high/low, Asia range, major 1H supply/demand zones.
- Check DXY: trending, ranging, or reversing?
- Check US10Y yields: calm or impulsive?
If you’re building your technical levels using supply/demand logic, you’ll likely enjoy our deeper zone work on the blog (browse topics via United Kings blog).
London open (first 60–90 minutes)
During London, you’re often looking for:
- Breakout from Asia range
- Stop hunts into liquidity pools
- Trend continuation if macro aligns
Run the 3-step checklist right before entry.
If DXY and yields are both neutral, you can rely more on price action. If they’re impulsive, you trade less or wait.
Pre-NY (10 minutes)
- Re-check DXY and yields: did the bias change?
- Identify whether gold is trending or ranging around $2650.
- Note any scheduled US data or Fed speakers.
NY open (first 60 minutes)
This is where correlation filtering pays the most.
NY can produce the day’s real move, but it also produces the day’s most brutal fakeouts.
If you see DXY break a key intraday level and yields impulse, don’t fight it with stubborn gold entries.
Post-trade review (5 minutes)
Log three things:
- Was DXY supportive, neutral, or hostile?
- Were yields supportive, neutral, or hostile?
- Did price action confirm cleanly?
After 20 trades, you’ll see patterns in your winners and losers.
This is how you turn “signals” into a personal edge.
11) How United Kings Traders Use Correlation to Improve Win-Rate Consistency
Signals are powerful, but execution is where traders separate.
At United Kings, our community focuses on trading the highest-quality windows—especially London and NY—because that’s where correlation and liquidity align.
What “premium signals” should include (and what we deliver)
When you receive a trade idea, you should never be guessing the basics.
Our premium Telegram signals are designed to be clean and executable:
- Clear Entry (exact price zones)
- Defined Stop Loss (realistic for XAUUSD volatility)
- Multiple Take Profits (structured scaling)
- Context and education so you learn while you trade
We aim for an 85%+ win rate across our tracked approach, but we never present that as a guarantee. Market conditions change, and risk management remains non-negotiable.
Why correlation filtering fits perfectly with Telegram signals
Telegram gives you speed.
Correlation gives you selectivity.
When you combine them, you stop taking every trade like it’s mandatory. You start taking the trades where the wind is at your back.
That’s how many traders reduce overtrading and improve equity curve smoothness.
Community and support
United Kings is built around a large, active community of 300K+ traders.
You’ll see how different traders apply correlation filters in real time, especially around fast NY moves.
If you’re primarily trading gold, start here: United Kings gold signals.
If you want to diversify beyond metals, explore: United Kings forex signals.
Pricing plans (3 options)
We keep the offer simple, with three plans that match different commitment levels:
- Starter (3 Months): $299 (~$100/mo)
- Best Value (1 Year): $599 (~$50/mo) with 50% savings + FREE ebook
- Unlimited (Lifetime): $999 pay once, access forever
You can review the plans any time on our pricing section: United Kings pricing plans.
12) FAQ: XAUUSD Correlation, DXY, and US10Y Yields
Is XAUUSD always inversely correlated with DXY?
No.
XAUUSD correlation with DXY is often inverse, but it can weaken or flip during strong risk-off events, inflation shocks, or positioning extremes. Use it as a filter, not a law.
Which matters more for gold: DXY or US10Y yields?
It depends on the regime.
In many intraday conditions, US10Y yield impulses can trigger the sharpest gold moves. DXY often provides the cleaner directional bias. When both align, gold tends to trend better.
What timeframe should I use to check correlation?
For practical trading, use:
- DXY: 1H for bias, 15m for structure
- US10Y yields: 1H for bias, 15m for impulse
- XAUUSD: 15m for setup, 5m for execution
Can correlation filtering help avoid false breakouts in gold?
Yes, often.
False breakouts commonly occur when gold breaks a level while DXY and yields are moving against the breakout direction. Your filter helps you demand stronger confirmation or skip the trade entirely.
I’m a beginner—should I trade XAUUSD using this method?
You can learn it, but start cautiously.
Gold is volatile, and beginners should practice on a demo account first, then move to small size. If you want a structured learning path alongside trade ideas, United Kings provides educational content with signals.
Risk Disclaimer: Forex and gold trading involves significant risk and may not be suitable for all investors. You can lose more than your initial deposit. Past performance is not indicative of future results. Nothing in this article is financial advice. Always use proper risk management, consider trading on a demo account first, and only risk capital you can afford to lose.
Ready to trade XAUUSD with clearer confirmation?
If you want premium gold and forex signals with clear Entry, SL, and TP levels—delivered in real time during the London and New York sessions—join the United Kings community.
Start with our full signals hub: United Kings premium signals.
Or go straight to gold: premium XAUUSD gold signals.
For immediate access and live updates, join our Telegram here: United Kings Telegram trading room.
Choose your plan anytime (Starter, Best Value, or Lifetime) on United Kings pricing, backed by a 48-hour money-back guarantee.