
Ever taken a gold signal, hit buy or sell instantly… and then watched XAUUSD spike $12 against you before it finally goes your way?
That feeling is usually not “bad luck.”
It’s a missing trade plan—specifically, missing confluence.
In today’s market, gold is trading around $2650 (+0.35% in the last 24h), with the Dollar Index near 106.80, USD/JPY around 149.50, EUR/USD near 1.0520, and GBP/USD around 1.2680.
That combination often produces sharp, stop-hunting wicks—especially during London and New York session transitions.
This guide is a complete, repeatable playbook for building a high-probability XAUUSD trade plan with Fibonacci confluence, using three pillars:
- United Kings gold signals (direction + entry/SL/TP structure)
- Fibonacci retracement/extension zones (38.2 / 61.8 / 127.2)
- Key levels: previous day high/low + round numbers (00/50/10s)
You’ll learn how to confirm entries, place more logical stops (typically $10–$25), and target cleaner 1:2 to 1:3 risk-reward setups without “false confidence” when levels conflict.
TL;DR: The XAUUSD Fibonacci Confluence Trade Plan
- Don’t trade Fibonacci alone. Use fib levels as a “zone,” then confirm with previous day high/low and round numbers.
- Best fib zones for gold signals: 38.2% (trend continuation), 61.8% (deeper pullback), and 127.2% (extension targets).
- Entry confirmation matters: wait for a candle trigger (rejection wick, engulfing, break-and-retest) near the confluence zone.
- Stops should be logical, not emotional: typically $10–$25 beyond the confluence zone and structure, not “tight because you feel confident.”
- Conflicting levels are a red flag: reduce size, wait for clearer structure, or skip the trade—especially before major news.
- Use a checklist. The same 7–10 questions before every trade keeps you consistent and protects your account.
Why Fibonacci Confluence Works So Well on XAUUSD (And Why It Fails)
Gold is one of the most technical major instruments in retail trading.
Not because it’s “easy,” but because it’s heavily traded, highly liquid, and reacts to repeated behaviors: profit-taking, hedging, and algorithmic rebalancing.
That’s exactly why a solid XAUUSD Fibonacci strategy can work—when you treat Fibonacci as a framework, not a magic line.
Here’s the truth: Fibonacci levels are not predictive on their own.
They become powerful when they align with other decision points that real traders watch: previous day high/low, round numbers like $2650 or $2660, and session liquidity (London open, NY open).
In the current environment, gold is hovering near a psychologically heavy zone: $2650.
Round numbers attract orders.
They also attract stop runs—because many traders place stops “just under 2650” or “just above 2660.”
Now add DXY at 106.80.
When the dollar is firm, gold can still rise—but the path is often choppy: a push up, a pullback, a second push.
This is where fib retracements shine: they help you plan the pullback entry rather than chase the breakout.
But Fibonacci fails in two common situations:
- Wrong swing selection: you draw fib from a random point instead of a clean swing high/low.
- No confirmation: you buy the 61.8% because “it’s 61.8%,” ignoring that price is breaking structure.
We avoid both by combining fib with a signal-first approach.
United Kings signals provide the directional bias and trade idea.
Your job is to confirm whether the market is offering a high-quality entry—at a level where other traders are likely to react.
If you’re new to executing signals with discipline, you’ll also like our broader execution framework on the site, starting from the main United Kings signals page where we explain how our entries, SL, and TP are structured.
Now let’s build the complete confluence plan step by step.
The Confluence Stack: Signals + Fib + Previous Day Levels + Round Numbers
Think of confluence like stacking probabilities.
One level is a “maybe.”
Three aligned levels is a “trade plan.”
In our playbook, confluence has four layers.
Layer 1: United Kings XAUUSD signal (direction + key prices).
Example: “BUY XAUUSD 2642, SL 2629, TP1 2668, TP2 2685.”
This gives you structure, not guesswork.
Our community trades these setups daily in our premium Telegram, focused on London and NY sessions where liquidity is best.
You can see our gold-focused offering on United Kings Gold Signals.
Layer 2: Fibonacci retracement zone (38.2% or 61.8%).
If the signal is a buy, we want price pulling back into a fib retracement zone of the most recent impulsive leg up.
If the signal is a sell, we want price retracing into fib resistance after a drop.
Layer 3: Previous day high/low (PDH/PDL).
Gold respects PDH/PDL because they’re natural “yesterday’s decision points.”
Institutions and day traders reference them as boundaries for range expansion.
Layer 4: Round-number levels (00/50 and the 10s).
On XAUUSD, levels like 2650, 2660, and 2675 matter because they cluster orders.
Round numbers also help with clean SL placement.
When these layers overlap, you get what we call a confluence zone.
Instead of “buying because the signal said buy,” you’re buying because:
- the signal bias is bullish,
- price pulled back into a fib zone,
- that zone aligns with PDL or a prior day midpoint,
- and it sits near a round number that attracts liquidity.
That’s the difference between a random entry and a high-probability plan.
It also helps you avoid overtrading when the market is messy.
If you want a broader view of how signals fit into a complete routine, you can browse the education hub on our blog—but this article will stand alone as your Fibonacci confluence blueprint.
How to Draw Fibonacci on Gold the Right Way (Swing Rules That Actually Work)
Most Fibonacci mistakes come from one problem: bad anchor points.
If your swing high/low is arbitrary, your fib levels are arbitrary.
Here’s a simple rule that keeps your fib clean on XAUUSD:
Draw fib only on an impulsive leg that broke structure.
In practice, that means you want a move that:
- broke above a prior high (bullish) or below a prior low (bearish),
- moved at least $15–$30 without major overlap,
- and closed strongly (not just wicked).
Let’s use realistic current pricing around $2650.
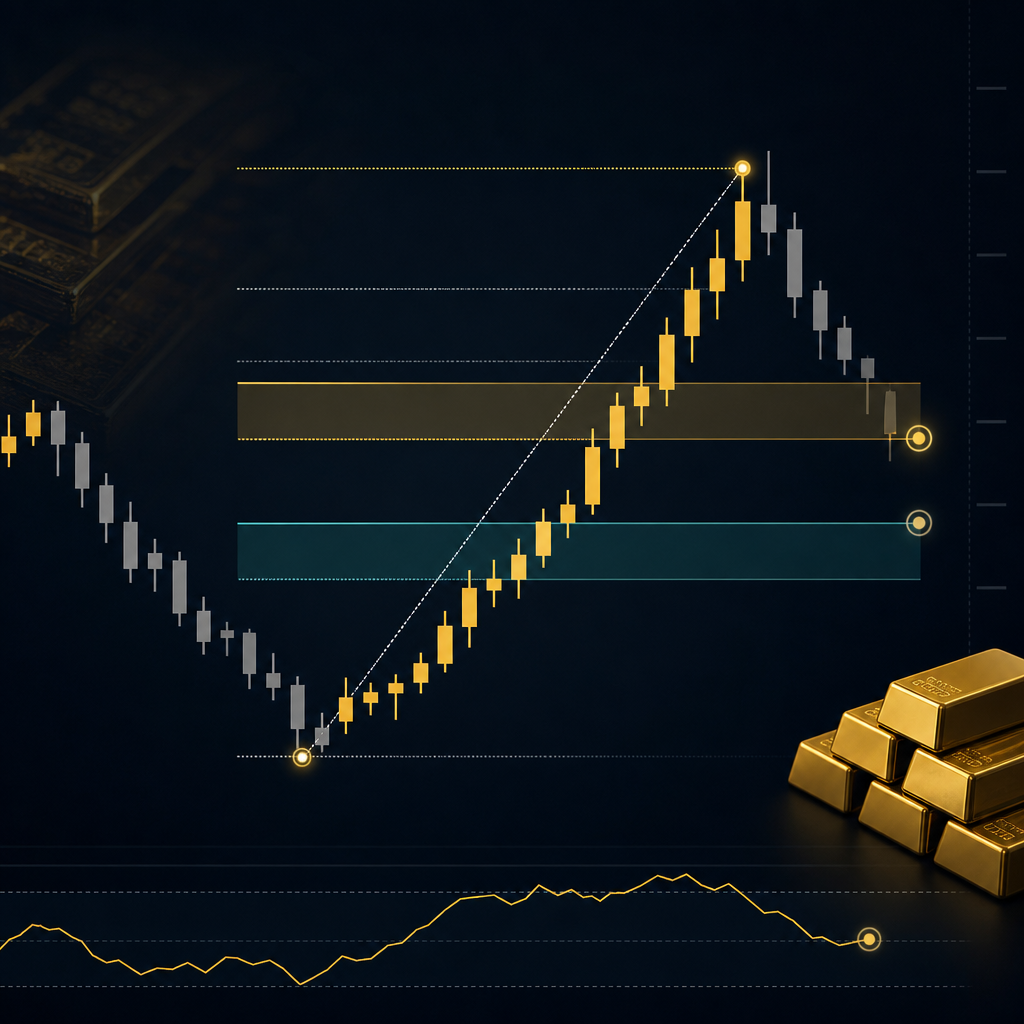
Scenario A (bullish impulse): gold rallies from $2620 to $2668 during London.
That’s a $48 impulse leg.
You draw fib from low (2620) to high (2668).
Your key retracement zones are approximately:
- 38.2% pullback: 2668 − (0.382 × 48) ≈ 2650.7
- 61.8% pullback: 2668 − (0.618 × 48) ≈ 2638.3
Notice how the 38.2% sits right near $2650.
That’s not “magic.”
It’s a common behavior: after a strong push, price often retests a round number and continues.
Scenario B (bearish impulse): gold drops from $2685 to $2645 in NY.
Draw fib from high (2685) to low (2645).
Key retracements become:
- 38.2% retrace up: 2645 + (0.382 × 40) ≈ 2660.3
- 61.8% retrace up: 2645 + (0.618 × 40) ≈ 2669.7
Now you’re watching 2660 and 2670 as potential sell zones.
Two more practical rules:
- Use the same timeframe consistently. For intraday signals, the 15M/30M/1H swings are usually more actionable than a random 4H swing.
- Treat fib as a zone, not a line. Gold regularly overshoots by $1–$3 before reversing.
That overshoot is where many traders get stopped out.
We’ll fix that with SL placement rules later.
Key Fibonacci Confluence Zones for XAUUSD: 38.2, 61.8, and 127.2
In a practical Fibonacci retracement gold trading plan, you don’t need 10 fib levels.
You need the few that show up repeatedly in real price behavior.
For our United Kings confluence model, three levels matter most:
- 38.2% retracement: trend continuation pullbacks
- 61.8% retracement: deeper pullbacks into value
- 127.2% extension: common profit-taking / TP magnet
38.2%: The “strong trend” entry zone.
When gold is trending hard—often during London breakouts—price may only retrace shallowly.
In our earlier example (2620 → 2668), the 38.2% sits around 2650.7.
If previous day high is around 2651 and 2650 is a round number, that’s a high-quality buy zone.
Your confirmation might be a 15M rejection candle that wicks below 2650 and closes back above 2652.
61.8%: The “patience pays” entry zone.
When gold is choppy—common when DXY is firm and US yields are moving—price often digs deeper.
The 61.8% zone (around 2638 in our example) is where you often see a more dramatic reversal.
But you must confirm structure.
A 61.8% touch during a breakdown is not a buy—it’s a falling knife.
127.2% extension: The realistic target zone.
Many traders target the 161.8% extension because it sounds impressive.
In real intraday gold trading, 127.2% is hit more frequently before a pullback.
Example: if your impulse leg is 2620 → 2668 (48 points), the 127.2 extension above 2668 is:
2668 + (0.272 × 48) ≈ 2681.1
That’s right inside our allowed example range, and it’s a clean TP2 area if you entered around 2642–2650.
How we use it with signals:
- TP1 often aligns with a prior high or PDH (e.g., 2668)
- TP2 often aligns with 127.2 extension + round number (e.g., 2680–2682)
This is the “signals + key levels” edge.
Signals give you the plan, fib gives you the map, and key levels give you the crowd behavior.
Step-by-Step: Build a High-Probability XAUUSD Trade Plan (Repeatable Checklist)
Here’s the exact process we recommend when you receive a United Kings gold signal.
Do it in order.
Don’t skip steps because you’re excited.
Step 1: Identify the signal type (continuation or reversal)
Ask: is this signal trading with the current session trend, or fading an extreme?
Continuation signals pair well with 38.2% pullbacks.
Reversal or “deep pullback” signals pair better with 61.8% zones.
Step 2: Mark previous day high (PDH) and previous day low (PDL)
These two lines instantly improve your context.
If price is below PDH and struggling, your buy needs stronger confirmation.
If price is above PDH and holding, dips are often bought aggressively.
Step 3: Draw Fibonacci on the most recent impulsive leg
Use the swing that broke structure, not a random micro-swing.
On a buy setup, draw from swing low to swing high.
On a sell setup, draw from swing high to swing low.
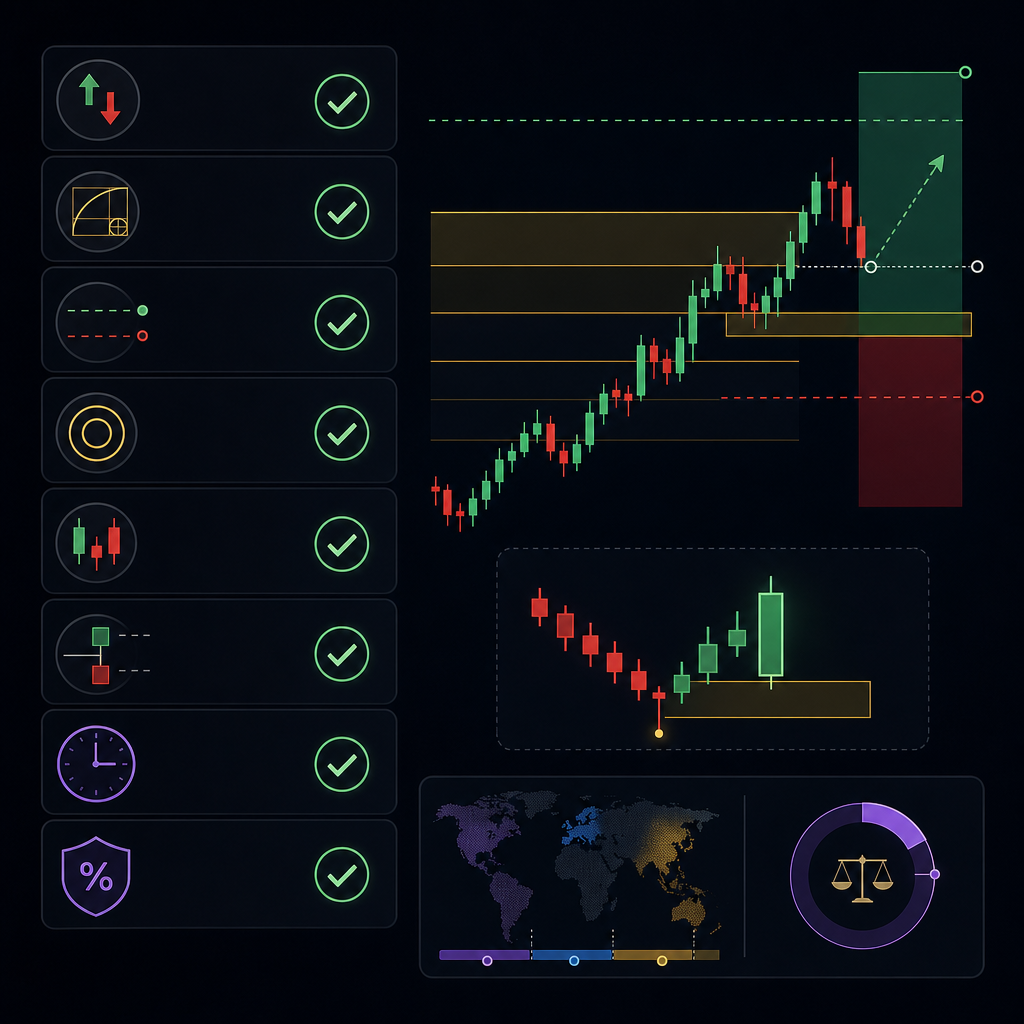
Step 4: Circle your confluence zone
You’re looking for overlap like this:
- Fib 38.2% near 2650 + PDL near 2649
- Fib 61.8% near 2638 + prior intraday support near 2640
- Fib 38.2% near 2660 + PDH near 2659 (for sells after a drop)
When you see 2–3 overlaps, you have a “zone.”
When you see only one, you have a “hope.”
Step 5: Demand a trigger candle
Gold can tag a level and keep going.
Your trigger reduces that risk.
Good triggers on 15M/30M:
- Rejection wick (long wick into the zone, close back out)
- Engulfing candle (bullish engulfing at support, bearish at resistance)
- Break-and-retest (price breaks minor structure, retests, then continues)
Step 6: Place SL beyond structure (not just beyond fib)
For gold, a typical SL is $10–$25 depending on volatility.
If your entry is 2642, a “too-tight” $5 stop is often noise.
A more logical SL might be 2629 (13 points) if structure supports it.
Step 7: Set TP using 1:2 to 1:3 plus fib extensions
If risk is $13 (2642 to 2629), then:
- 1:2 target = $26 → 2668
- 1:3 target = $39 → 2681
Those line up beautifully with our earlier fib extension math.
Step 8: Decide execution style (limit vs market)
If you have a clean confluence zone, a limit order can work.
If the market is fast (NY open), waiting for confirmation and using a market entry can reduce getting filled on a “knife.”
Step 9: Log the trade
Write down: signal, fib swing, confluence reasons, SL/TP logic.
This is how you improve.
If you want a deeper risk and process framework, pair this article with our risk guide: risk management strategies when using forex signals.
Realistic Trade Examples Around $2650: Confluence Buy and Confluence Sell
Let’s make this concrete with two realistic examples using current pricing.
These are educational scenarios, not trade promises.
Example 1: Confluence BUY after a London impulse
Context: Gold pushes from 2620 to 2668 in London.
Price then pulls back as NY approaches, with DXY holding near 106.80.
Fibonacci: Draw from 2620 (low) to 2668 (high).
Key zones:
- 38.2% ≈ 2650.7
- 61.8% ≈ 2638.3
Key levels: Suppose previous day high is near 2651.
Round number: 2650.
Now you have a stacked zone: fib 38.2 + PDH + round number.
Trigger: On 15M, price wicks down to 2649.6, then closes at 2653.2 (rejection).
Entry plan: Buy around 2653 (market after trigger) or limit near 2651 if you prefer.
Stop loss: Put SL beyond the wick/structure, e.g., 2639 (about $14 risk from 2653).
This avoids getting clipped by a second dip into 2646–2648.
Take profit:
- TP1 at prior high 2668 (15 points ≈ 1:1)
- TP2 at 127.2 extension zone 2680–2682 (27–29 points ≈ ~1:2)
- Optional TP3 near 2685 if momentum is strong (32 points ≈ ~1:2.3)
Management: After TP1, many traders move SL to breakeven or reduce risk.
But don’t rush it—gold often retests.
Example 2: Confluence SELL after a NY drop and retracement
Context: Gold sells from 2685 down to 2645 as USD/JPY holds firm near 149.50.
Then price retraces upward into resistance.
Fibonacci: Draw from 2685 (high) to 2645 (low).
Key retracement zones:
- 38.2% ≈ 2660.3
- 61.8% ≈ 2669.7
Key levels: Suppose previous day low is around 2660 (now acting as resistance).
Round number: 2660 and 2670.
Trigger: Price taps 2661.0, prints a bearish engulfing on 15M, and closes below 2657.
Entry plan: Sell around 2657–2659.
Stop loss: Logical SL above 2670/structure, e.g., 2674 (15–17 points risk).
Take profit:
- TP1 back to 2645 (12–14 points)
- TP2 to 2630–2632 (25–29 points ≈ ~1:2)
Notice how both examples use the same logic: signal idea + fib zone + PDH/PDL + round number + trigger candle.
That’s how you turn a “signal” into a trade plan.
Comparison Table: Fibonacci-Only vs Confluence Plan vs Signal-First Confluence
Many traders think they’re trading “smart” because they use Fibonacci.
But the difference between a hobbyist and a professional is process.
Here’s the practical comparison.
| Approach | What You Rely On | Typical Result on XAUUSD | Best Use Case | Main Risk |
|---|---|---|---|---|
| Fibonacci-only | Buying/selling 38.2 or 61.8 “because it’s a fib” | Frequent stop-outs from wicks; inconsistent RR | Learning charting basics | False confidence; poor swing selection |
| Confluence plan (manual) | Fib + PDH/PDL + round numbers + candle trigger | Higher-quality entries; fewer trades; better SL logic | Independent discretionary trading | Analysis paralysis; missing moves |
| Signal-first confluence (United Kings style) | Premium signal direction + your confluence confirmation | Cleaner execution; consistent rules; scalable routine | Busy traders who want structure + education | Overtrading if you ignore the checklist |
The goal isn’t to “be right” on every trade.
The goal is to take the trades where your odds are best—and your risk is controlled.
How to Set Precise SL/TP on Gold Using Fib + Structure (Without Getting Wicked Out)
Gold is notorious for stop hunts.
But most “stop hunts” are just traders placing stops where everyone else places them.
If your SL is always $6–$8 on XAUUSD during active sessions, you’re often donating to volatility.
Here’s a practical SL/TP framework that fits the market context around $2650.
1) Stop loss placement: beyond the confluence zone + beyond the trigger wick
When you enter from a confluence zone, your invalidation is not “below the fib line.”
Your invalidation is “below the zone and below the structure that should hold.”
Practical SL distances:
- Calm session / pre-London: $10–$14 is often workable
- London + NY overlap: $15–$25 is often more realistic
Example: Buy 2651 at fib 38.2 + PDH.
If the rejection wick low is 2648, placing SL at 2647 is asking to get clipped.
A better SL could be 2638–2640 if that’s below the 61.8 zone or below a clear swing low.
You’re paying for “room to breathe.”
2) Take profit placement: mix RR math with fib extensions
Start with risk-reward first.
If your SL is $15, a 1:2 TP is $30.
Then see where that lands relative to structure and fib extensions.
Example: Buy 2642, SL 2629 (risk $13).
- 1:2 target = 2642 + 26 = 2668 (often near prior high)
- 1:3 target = 2642 + 39 = 2681 (often near 127.2 extension)
That’s not coincidence.
That’s why fib extensions are useful: they often align with RR-based targets.
3) Partial profits and trailing: keep it boring
A simple management plan:
- Take partial at TP1 (structure level like prior high)
- Move SL to reduce risk only after price closes beyond a key level (not just a wick)
- Hold the remainder to TP2 (127.2 extension / round number)
Gold will tempt you to micromanage.
Micromanagement usually converts winning trades into break-even trades.
4) Spread and execution reality
During volatile moments (news spikes), spreads widen and entries slip.
That means your “$13 risk” might become $15 in real fills.
Build that into your plan by avoiding paper-thin stops.
When Levels Conflict: How to Avoid False Confidence and Bad Trades
This is the part most traders ignore.
They learn confluence and then assume “more lines = more money.”
But sometimes confluence disagrees.
And when it does, the correct move is often: do less.
Common conflict scenarios on XAUUSD
- Fib says buy, PDH says sell: price is pulling back into 61.8, but it’s also directly under previous day high (resistance).
- Signal says buy, structure says lower lows: you’re trying to buy while the market is still breaking down.
- Round number magnet in the middle: your entry is too close to 2650/2660 where price whips both sides.
What we do when levels conflict (a practical decision tree)
Option 1: Wait for confirmation that resolves the conflict.
Example: If price is under PDH, wait for a 15M close above PDH and a retest.
That turns resistance into support.
Option 2: Reduce position size.
If your plan normally risks 1%, risk 0.5% when the setup is “good but messy.”
This keeps you in the game without forcing certainty.
Option 3: Skip the trade.
Skipping is a skill.
Gold offers new opportunities daily, especially in London and NY sessions.
How to spot “fake confluence”
Fake confluence is when you draw fib swings until you find a level that matches your bias.
If you had to redraw fib three times, you’re not analyzing—you’re negotiating.
One clean swing. One clean plan.
News and volatility: the silent conflict
Even perfect confluence can fail during surprise headlines.
Gold reacts instantly to geopolitical risk, central bank commentary, and data surprises.
When major events hit, the best plan is often to wait for the first impulse and then trade the pullback.
For a deeper guide on handling sudden volatility, read: how gold signals react to unexpected news events.
Session Timing: Why London and NY Make Fib Levels More Reliable
Fibonacci levels are not “strong” because of math.
They’re strong because many participants react at similar areas.
Participation changes by session.
That’s why timing matters.
London session: trend initiation and clean impulses
London often sets the day’s direction for gold.
You’ll commonly see:
- an early liquidity sweep,
- a strong impulse move ($20–$50),
- then a fib pullback to 38.2 or 50.
This is ideal for continuation trades.
If gold is around $2650 and London just impulsed up to 2668, the 38.2 pullback near 2651 becomes a high-quality area.
New York session: reversals, deeper pullbacks, and stop runs
NY can extend London’s trend or reverse it.
It’s also where you see more violent wicks—especially when US data hits.
That’s why 61.8 pullbacks and break-and-retest confirmations become more important.
London-NY overlap: the “best and worst” time
Liquidity is high, which is good.
But volatility is also high, which punishes sloppy stops.
In this window, we prefer:
- clear confluence zones,
- trigger candles,
- and SLs that respect the $15–$25 reality.
Asian session: range behavior and patience
Gold can range more in Asia.
Fib still works, but targets may be smaller.
If you’re using signals, you may choose to execute only during London/NY for consistency.
This aligns with how United Kings structures most of our high-probability opportunities.
How to Combine United Kings Gold Signals With Your Fib Plan (The Clean Workflow)
Signals are most powerful when they reduce decision fatigue.
But they’re most profitable when you execute them with a consistent framework.
Here’s a clean workflow you can use daily.
1) Receive the signal and categorize it
Is it a breakout continuation, pullback entry, or reversal?
Most high-quality gold signals include:
- Entry (or entry zone)
- Stop loss
- Take profit levels (TP1/TP2)
United Kings signals are designed to be clear and actionable, with a strong focus on precision and discipline.
2) Check your chart for confluence (2 minutes, not 20)
Mark PDH/PDL.
Draw fib on the last impulse.
Identify whether the signal entry sits near:
- 38.2 or 61.8 retracement,
- a previous day level,
- a round number (like 2650/2660).
If you see alignment, it’s a green light.
If you see conflict, you switch to “reduced risk” or “wait for trigger.”
3) Execute with rules, not emotion
If the signal is a limit entry, you can still require confirmation by using an alert and entering manually after a trigger.
If the signal is a market entry, you can wait for the candle close to reduce fakeouts.
4) Manage the trade like a business
Take partials at structure.
Let the rest run to extension targets.
Don’t widen stops because you “feel” it will come back.
5) Learn from the community
One underrated advantage of a large trading community is feedback.
United Kings has 300K+ active traders, which means you see how others interpret the same zone and how execution differs.
If you want to see how our Telegram environment works, you can join our official channel here: United Kings Telegram trading community.
If you’re still evaluating providers, you can also review our due-diligence checklist article: forex trading signals provider checklist.
The “Before You Click Buy/Sell” XAUUSD Confluence Checklist
Print this checklist.
Or save it in your notes.
This is what keeps you consistent when gold is moving fast.
Market context checklist (30 seconds)
- Is XAUUSD around a major psychological level (e.g., 2650)?
- Is DXY strong near 106.80 or weakening?
- Are we in London, NY, or the overlap?
Signal alignment checklist (1 minute)
- Does the signal direction match the current intraday structure (higher highs/lows or lower highs/lows)?
- Is the signal entry near a fib retracement zone (38.2 or 61.8)?
- Is the entry near PDH/PDL or a clear intraday support/resistance?
- Is there a round number within $1–$3 of the entry (00/50/10s)?
Execution checklist (1 minute)
- Do we have a trigger candle (rejection, engulfing, break-retest)?
- Is the SL placed beyond structure by a realistic amount ($10–$25)?
- Do TP levels align with 1:2 or 1:3 RR and/or 127.2 extension?
Risk checklist (30 seconds)
- Is position size correct for your account?
- Is this trade worth taking if it loses (emotionally and financially)?
- Are you trading to your plan, or trading to “make back” a loss?
This checklist is how you keep a high win rate from turning into a blown account.
Execution without risk control is just gambling with better charts.
Common Mistakes With Fibonacci Confluence on Gold (And How to Fix Them)
Even good traders sabotage themselves with small, repeated errors.
Here are the most common ones we see in gold signal execution.
Mistake 1: Treating fib levels like exact prices
Gold doesn’t reverse at “2650.70” perfectly.
It reverses in an area.
Fix: Use zones of $2–$5 around the fib level, then require a trigger candle.
Mistake 2: Placing stops inside the noise
If your SL is $7 and the average 15M candle is $4–$8, you’re basically flipping a coin.
Fix: Place SL beyond the wick and beyond structure, typically $10–$25 depending on session volatility.
Mistake 3: Using fib on the wrong swing
Drawing fib on a tiny swing inside a range gives you meaningless levels.
Fix: Only draw fib on the impulse that broke structure.
Mistake 4: Ignoring previous day levels
PDH/PDL are “free confluence.”
When you ignore them, you buy into resistance or sell into support.
Fix: Mark PDH/PDL before you draw fib. Always.
Mistake 5: Overconfidence when confluence stacks up
More confluence doesn’t mean “no loss possible.”
It means the trade is worth taking with controlled risk.
Fix: Keep risk per trade consistent. Don’t double lot size because you see three lines.
Mistake 6: Trading through surprise volatility
Gold can move $20 in a minute on headlines.
Fix: If you’re unsure, reduce size or wait for the post-spike retracement to your fib zone.
If you want a robust foundation on signal execution beyond gold, you can also explore our broader services at United Kings Forex Signals—many traders combine FX and gold for diversification.
FAQ: XAUUSD Fibonacci Strategy and Gold Signals Confluence
1) What is the best Fibonacci level for gold trading?
For intraday XAUUSD, 38.2% often works best in strong trends, while 61.8% is better for deeper pullbacks in choppy conditions. Use them as zones and confirm with PDH/PDL and a trigger candle.
2) How do I choose the correct swing high/low for Fibonacci on XAUUSD?
Choose the most recent impulsive move that broke structure (a clear break of a prior high/low with strong candle closes). Avoid drawing fib on small internal swings inside a range.
3) What is Fibonacci confluence in gold signals?
Confluence is when multiple factors align at the same price area—typically a fib retracement (38.2/61.8) overlapping with previous day high/low and a round number like 2650 or 2660. This increases the probability that price reacts there.
4) How far should my stop loss be on XAUUSD?
In active London/NY conditions, a practical SL is often $10–$25 from entry, placed beyond structure and beyond the trigger wick. Too-tight stops ($5–$8) often get hit by normal volatility.
5) Can I rely only on Fibonacci to trade gold profitably?
You can test it, but Fibonacci alone tends to produce inconsistent results because swing selection and volatility noise matter. A signal-first confluence plan (signal + fib + PDH/PDL + round numbers + confirmation) is typically more repeatable.
Risk Disclaimer (Read This Before You Trade)
Forex and gold (XAUUSD) trading involves significant risk and may not be suitable for all investors.
You can lose some or all of your capital, especially when using leverage.
Nothing in this article is financial advice, and past performance does not guarantee future results.
If you’re a beginner, we strongly recommend practicing on a demo account before risking real money, and using strict position sizing rules on every trade.
Join United Kings: Trade XAUUSD With Structure, Confluence, and Discipline
If you want to stop guessing and start executing a repeatable plan, combine this Fibonacci confluence framework with United Kings premium Telegram signals.
We provide clear Entry, SL, and TP levels, educational guidance, and a community of 300K+ active traders focused on London and NY session opportunities.
Explore our full signals offering here: United Kings Signals, or go directly to the gold-specific service: United Kings Gold Signals.
Ready to choose a plan?
- Starter (3 Months): $299 (~$100/mo)
- Best Value (1 Year): $599 (~$50/mo, 50% savings + FREE ebook)
- Unlimited (Lifetime): $999 (pay once, access forever)
See all three options on our pricing section: United Kings pricing plans.
And if you want to join the conversation and watch how we map levels in real time, join our official Telegram now: https://t.me/unitedkings1.
Your next step: take the checklist from this article, apply it to the next 10 gold signals you see, and track the difference in your entries, SL placement, and consistency.
That’s how traders level up—one disciplined execution at a time.


