Gold is at $2650 and it’s moving like a market that knows everyone is watching.
You open XAUUSD, you see a 30–80 dollar swing in a day, and you think: “How do people trade this without getting chopped to pieces?”
This xauusd trading guide is built to answer that question from the ground up, using realistic examples around today’s market context: XAUUSD $2650 (+0.35%), EUR/USD 1.0520, GBP/USD 1.2680, USD/JPY 149.50, and DXY 106.80.
TL;DR (Key Takeaways)
- XAUUSD is not “just another pair”: it reacts to USD strength (DXY 106.80), real yields, risk sentiment, and liquidity hunts.
- Best trading windows are typically London open and New York session (and especially the overlap), when spreads tighten and liquidity improves.
- Build every gold trade around a plan: entry + invalidation + position size + 1:2 to 1:3 RR targets (e.g., $12 risk to make $24–$36).
- Use correlations as a filter, not a signal: DXY up can cap gold, falling yields can fuel gold, USD/JPY risk moves often echo in XAUUSD volatility.
- Gold punishes oversized positions: a $20 move is normal; risk 0.5%–1% per trade and accept that patience is part of the edge.
- If you want structure and speed, trade alongside a proven framework and community like United Kings’ Gold signals with clear Entry/SL/TP levels.
1) What Is XAUUSD and Why Gold Trades Differently
XAUUSD is the price of gold (XAU) quoted in US dollars (USD).
When you trade XAUUSD, you’re not trading a company or a country’s currency policy alone.
You’re trading a global “macro asset” that sits at the intersection of inflation expectations, central-bank credibility, geopolitical stress, and USD liquidity.
That’s why gold can rally even when the news feels “neutral.”
It’s also why gold can dump $25 in minutes on a hot CPI print, then reverse and finish green.
Gold is a “risk-off” asset… until it isn’t
Many traders learn the simplified rule: risk-off = gold up.
In practice, gold is more nuanced.
Sometimes risk-off means USD demand spikes, DXY jumps, and gold initially dips because it’s priced in dollars.
Then gold may rebound as fear deepens and real yields fall.
So the sequence matters: USD liquidity first, then hedging flows.
Why XAUUSD volatility is both opportunity and danger
At $2650, a typical active day might see gold travel from $2636 to $2668.
That’s a $32 range, which is “normal” in many weeks.
If you’re risking $5 on a stop loss, you’ll get stopped constantly.
If you’re risking $50, you may survive noise but blow your account when the real move comes.
The sweet spot for many intraday traders is $10–$25 stop distance, sized properly.
XAUUSD is a CFD/spot symbol in many brokers
Most retail traders access gold via spot gold CFDs.
That means your broker’s pricing is derived from underlying markets (spot + futures), plus spread and sometimes commission.
This matters because spreads can widen during news and at session transitions.
It also matters because execution and slippage can be the difference between a clean 1:3 winner and a frustrating scratch.
What “one dollar” means in XAUUSD
On many platforms, XAUUSD is quoted to 2 decimals (e.g., 2650.00).
A move from 2650.00 to 2651.00 is a $1 move in gold price.
Your profit depends on contract size (lot size) and broker specification.
Before you trade live, confirm how much $1 equals per 0.01 lot, 0.10 lot, and 1.00 lot on your broker.
2) The Fundamentals That Move Gold (And How to Track Them)
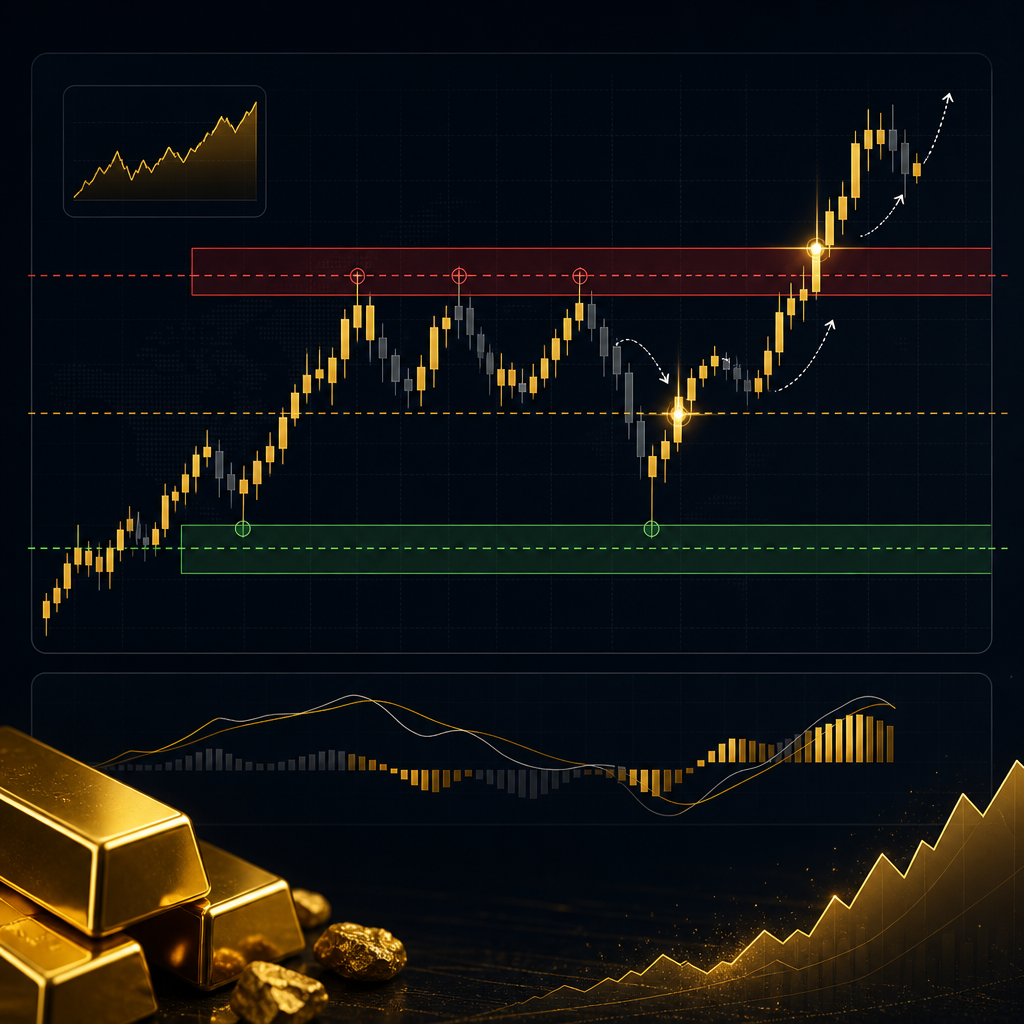
To trade gold profitably, you need a simple truth: gold is a macro headline magnet.
You don’t need an economics degree, but you do need a repeatable way to interpret the same drivers every day.
When gold is hovering around $2650, the market is constantly re-pricing the next 1–3 months of inflation and rate expectations.
Driver #1: Real yields (not just “rates”)
Gold has no yield.
So when real yields (nominal yields minus inflation expectations) rise, gold often faces headwinds.
When real yields fall, gold often gets support.
Even if you don’t chart real yields directly, you can approximate it:
- Strong US data + hawkish Fed tone = yields up = gold pressured.
- Weak US data + dovish expectations = yields down = gold supported.
In practice, you’ll often see gold stall near resistance while yields tick higher.
Then you’ll see gold break higher when yields roll over.
Driver #2: The US Dollar (DXY 106.80)
DXY at 106.80 is a “firm dollar” backdrop.
A stronger USD typically makes gold more expensive for non-USD buyers.
So sustained DXY strength can cap rallies.
But don’t turn it into a rigid rule.
Gold can still rally with a strong dollar when the market is pricing systemic risk or aggressive central bank buying.
Driver #3: Inflation expectations and the Fed reaction function
Gold loves two conditions:
- Inflation worry (currency purchasing power fear).
- Policy uncertainty (the sense that central banks are behind the curve).
When inflation is high but the Fed is expected to stay restrictive, gold can chop violently.
That’s because the market is torn between “inflation hedge” and “high real yield headwind.”
That environment is where technical levels matter most.
Driver #4: Geopolitics and risk events
Gold is the classic hedge when headlines hit.
But the first reaction is often messy.
Spreads widen, stops get swept, and then the real direction emerges.
If you trade around news, you need rules for volatility spikes.
We break down survival behavior in how gold signals react to unexpected news events.
Driver #5: Central bank and physical demand
One reason gold has remained resilient in recent years is structural demand.
Central banks diversify reserves, and physical demand ebbs and flows with prices.
As traders, we don’t “predict” these flows day-to-day.
We respect them as a backdrop that can make dips buyable and rallies extend further than expected.
3) XAUUSD Session Timing: When Gold Moves (and When It Traps You)
Gold trades 24 hours a day, five days a week.
But it doesn’t trade the same way all day.
If you want to stop feeling like price is random, start by trading the right hours.
Asian session: range-building and stop hunts
Asia often prints a tighter range compared to London/NY.
That range becomes a “liquidity pool” later.
For example, gold might drift between $2641 and $2652 in Asia.
Then London comes in and runs one side first, triggering stops, before the real move begins.
This is why many traders get trapped by early breakouts.
London open: momentum and structure breaks
London is where gold often picks a direction.
Liquidity increases, spreads generally tighten, and technical levels get respected more cleanly.
A common pattern is:
- London sweeps the Asian high/low.
- Price snaps back into the range.
- Then it breaks the opposite side with momentum.
If you’ve ever been stopped out and watched price go your way, you’ve likely been the liquidity.
New York session: data-driven volatility
New York is where US data and bond moves hit hardest.
With DXY at 106.80 and USD/JPY at 149.50, gold is sensitive to USD impulses.
NY can trend strongly, but it can also reverse London’s move.
That’s why your plan must include invalidation levels, not vibes.
London–New York overlap: the “sweet spot” for many traders
The overlap is often the highest-liquidity window.
This is where many of our members prefer to execute because:
- Spreads are usually tighter.
- Moves are cleaner and more follow-through.
- Breakouts have better odds of continuation.
If you want a deep dive on low-slippage execution, read our blog and especially the session-based execution content.
Practical session rule (simple and effective)
If you’re a beginner, pick one window and master it.
For example: trade only London open to first half of NY.
That alone reduces overtrading and improves pattern recognition.
4) Gold Correlations: DXY, USDJPY, EURUSD, and Risk Sentiment

Correlations in gold are powerful, but they’re also misunderstood.
You don’t use correlations to predict exact entries.
You use them to filter bad trades and time the best ones.
Gold vs DXY (106.80): the classic inverse relationship
In many environments, gold and DXY move inversely.
If DXY is pushing higher with momentum, gold rallies often stall near resistance.
If DXY rolls over, gold pullbacks often find support and bounce.
Today’s context (DXY 106.80) suggests you should be cautious chasing late gold breakouts without confirmation.
Gold vs USD/JPY (149.50): risk and rates proxy
USD/JPY is heavily influenced by yield differentials.
When USD/JPY is ripping higher, it often reflects stronger USD and/or rising US yields.
That can pressure gold.
When USD/JPY drops sharply, it can align with falling yields and risk-off, which can support gold.
Gold vs EUR/USD (1.0520) and GBP/USD (1.2680)
EUR/USD and GBP/USD are major drivers inside DXY.
If EUR/USD is heavy near 1.0520 and slipping, that often supports DXY strength.
That can create headwinds for gold to push through resistance zones like $2668–$2690.
But again: it’s a filter, not a trigger.
Correlation checklist you can use daily
- Is DXY trending or ranging? Trending DXY can suppress gold follow-through.
- Are yields rising fast? Rising yields can fade gold rallies.
- Is USD/JPY impulsive? Sharp moves often coincide with gold volatility spikes.
- Is risk sentiment fragile? Risk-off can create sudden gold bids.
If you want a dedicated framework for this, pair this guide with our correlation-focused education and execution inside our signals hub.
One real scenario (around current prices)
Gold is at $2650 and breaks above $2658.
At the same time, DXY breaks above 107.00 and USD/JPY pushes 150.00.
That’s a warning sign.
The breakout can still work, but odds of a pullback increase.
A smarter approach is to wait for gold to reclaim $2658 after a dip, or for DXY to stall first.
5) XAUUSD Chart Basics: Levels, Structure, and Clean Price Action
Gold rewards traders who keep charts simple.
It punishes traders who stack ten indicators and then hesitate at the moment of execution.
The foundation is market structure + key levels + confirmation.
Start with higher timeframe structure (H4 and D1)
Before you drop to the 5-minute chart, mark your zones on H4/D1.
In the $2610–$2690 band, you might identify:
- Major support: $2610–$2620 (buyers previously defended).
- Mid-range pivot: $2640–$2650 (chop zone, decision point).
- Resistance: $2668–$2690 (supply zone, profit-taking area).
These zones become your map.
Your lower timeframe entries are just “tactics” executed on that map.
Understand impulse vs correction (the gold rhythm)
Gold often moves in sharp impulses, then slow corrections.
Example:
- Impulse: $2638 → $2662 in 20–40 minutes.
- Correction: $2662 → $2652 over the next hour.
Beginners chase the impulse and panic in the correction.
Pros wait for the correction and enter where risk is defined.
Two price action signals that matter most
- Rejection candles at key zones: long wicks at $2668–$2690 can signal supply.
- Break and retest: gold breaks $2650, retests $2650–$2648, then continues.
These work because they reflect order flow: failed attempts, trapped traders, and fresh liquidity.
Stop placement: invalidation, not “pain tolerance”
A gold stop should sit where your idea is wrong.
Not where it “feels safe.”
Example long:
- Entry: $2648.00 after reclaiming support.
- Invalidation: below $2636.00 (structure low).
- Stop: $2635.50 (risk $12.50).
- TP1: $2673.00 (reward $25).
- TP2: $2685.50 (reward $37.50).
This is clean 1:2 to 1:3 risk-reward logic.
Keep your chart “quiet”
If you want one indicator, use ATR for volatility awareness.
But let price lead.
For an ATR-based approach to stops and targets, see ATR stop loss and take profit for XAUUSD.
6) The Best XAUUSD Strategies (Beginner to Advanced)
There isn’t one magic xauusd strategy that works in all conditions.
There are strategies that fit specific market states: trending, ranging, and news-driven volatility.
Below are four practical approaches, each with an example around $2650.
Strategy A: Support/Resistance Reversal (Beginner-friendly)
This is the classic: trade rejection at a major zone.
Example:
- Gold rallies into resistance: $2668–$2672.
- You see a rejection wick and bearish follow-through on M15.
- Sell entry: $2666.50.
- Stop: $2682.50 (risk $16).
- TP: $2634.50 (reward $32, 1:2).
Key rule: only take reversals at real zones, not random mid-range levels.
Strategy B: Break and Retest (The “professional default”)
This is one of the most reliable ways to trade gold because it avoids chasing.
Example:
- Gold breaks above $2658 with momentum during London.
- It pulls back to retest $2658–$2655.
- Buy entry: $2659.00 after bullish confirmation.
- Stop: $2647.00 (risk $12).
- TP1: $2683.00 (reward $24, 1:2).
- TP2: $2695.00 (reward $36, 1:3) (only if volatility supports it).
Filter: if DXY is surging and yields are spiking, reduce size or skip.
Strategy C: Liquidity sweep into reversal (Intermediate)
Gold loves to “run stops” above obvious highs/lows.
Example:
- Asian high sits at $2652.
- London spikes to $2656, then snaps back below $2652.
- Sell entry: $2650.80.
- Stop: $2662.80 (risk $12).
- TP: $2626.80 (reward $24, 1:2).
This strategy is deadly when combined with session timing.
If you want a dedicated playbook, pair this guide with our liquidity education inside United Kings Gold signals where setups are delivered with Entry/SL/TP.
Strategy D: Trend continuation with pullback (Advanced)
When gold trends, it often respects a moving average or a structure ladder.
Instead of buying highs, you buy pullbacks to prior demand.
Example:
- Trend bias bullish above $2640.
- Pullback into $2646–$2642 zone.
- Buy entry: $2644.50.
- Stop: $2629.50 (risk $15).
- TP: $2674.50 (reward $30, 1:2).
Advanced rule: you must define where the trend is invalidated.
Otherwise you’ll keep “buying dips” into a trend reversal.
7) Indicators for Gold (Minimal, Practical, and Not Overfit)
Indicators can help in gold trading, but only if they do one of two things:
- Measure volatility and help you size stops.
- Help you align with trend and avoid counter-trend entries.
Anything beyond that often becomes noise.
ATR (Average True Range): the gold trader’s best friend
ATR tells you how much gold typically moves.
If ATR is high, your stop needs breathing room.
If ATR is low, tighter stops can work.
At $2650, if M15 ATR is $3.50 and you’re using a $6 stop, you’re risking less than 2x ATR.
That might be fine in calm conditions.
In volatility spikes, it’s a recipe for repeated stop-outs.
Moving averages (EMA 20/50): trend alignment, not entries
EMAs can help you avoid fighting the tape.
If price is consistently below EMA50 on H1 and making lower highs, you should be cautious with longs.
If price is above EMA50 and holding higher lows, you should be cautious shorting support.
But don’t use EMA crosses as a standalone signal.
Gold will whipsaw you.
RSI: useful for divergence at real levels
RSI is not a “buy oversold” button.
It becomes useful when you combine it with structure.
Example:
- Gold makes a lower low at $2632.
- RSI makes a higher low.
- This divergence at a marked support zone can justify a reversal attempt.
Still, you need a stop and a plan.
Volume: helpful, but understand your data
Spot gold volume on retail platforms is often “tick volume,” not centralized exchange volume.
It can still be useful as a proxy.
But don’t treat it as exact institutional volume.
Indicator rule that keeps you profitable
Pick one volatility tool (ATR) and one trend tool (EMA50), then master price action.
That’s enough to trade gold professionally.
8) Risk Management for XAUUSD: Position Sizing, Stops, and Trade Limits
If you take only one section seriously, take this one.
Most gold traders don’t fail because their entries are terrible.
They fail because their risk is inconsistent.
Why gold demands smaller risk per trade
Gold can move $10 in minutes.
That’s normal volatility, not “bad luck.”
So if you risk 3% per trade, a short losing streak can crush you.
A more sustainable approach is 0.5% to 1% per trade, especially for beginners.
Step-by-step: how to size a gold trade (simple method)
- Choose account risk (example: 1%).
- Define stop distance (example: $15 on XAUUSD).
- Calculate $ risk (example: $5,000 account → 1% = $50).
- Compute position size so that a $15 stop equals ~$50 loss.
- Place SL and TP immediately (no “mental stops” on gold).
Your broker’s contract specs differ, so confirm pip/point value.
But the logic never changes: risk is defined first, size is derived second.
Stop loss placement rules that reduce random losses
- Stops go beyond structure, not inside it.
- Avoid placing stops exactly on round numbers (e.g., $2650.00).
- Respect session volatility: London/NY needs more room than late US.
A common gold stop range is $10–$25 depending on timeframe.
Then you target 1:2 or 1:3.
Trade limits (anti-overtrading framework)
Gold is addictive because it moves.
That’s also how it drains accounts.
Use hard limits:
- Max 2–3 trades per session.
- Daily max loss: 2R (two full risk units).
- Stop trading after 2 consecutive losses unless an A+ setup appears.
If you’re building this into a signal-following plan, read risk management strategies when using signals.
Scaling and partials (how pros reduce stress)
Instead of one all-or-nothing take profit, use partial exits.
Example long from $2648 with $12 risk:
- TP1 at +$12 to +$18 (bank partial, reduce emotion).
- Move stop to breakeven only after structure confirms.
- TP2 at +$24 to +$36 (1:2 to 1:3).
This keeps you in runners while protecting your equity curve.
9) A Practical XAUUSD Trading Plan (Daily Routine You Can Follow)
Most traders don’t need more strategies.
They need a repeatable routine that stops impulsive trades.
Here’s a simple daily plan built for gold around current conditions.
Step 1: Pre-market (10 minutes)
- Mark key zones on H4/H1: support ($2610–$2620), pivot ($2640–$2650), resistance ($2668–$2690).
- Check DXY (106.80) direction and whether it’s trending.
- Note USD/JPY (149.50) behavior: calm or impulsive?
- Scan the economic calendar for high-impact USD events.
Your goal is not prediction.
Your goal is to know what could change volatility.
Step 2: Build a bias (conditional, not emotional)
Bias examples:
- Bullish if gold holds above $2640 and DXY stalls.
- Bearish if gold fails at $2668–$2690 and DXY breaks higher.
- Neutral if gold is trapped inside $2640–$2650 and correlations are mixed.
Neutral is a position.
Sitting out is a skill.
Step 3: Execution rules (your “if-then” statements)
- If price breaks and retests a zone, then enter on confirmation.
- If price sweeps liquidity and re-enters the range, then look for reversal.
- If price is mid-range with no catalyst, then do nothing.
These rules prevent revenge trading.
Step 4: Post-trade review (5 minutes)
- Screenshot entry and exit.
- Write one sentence: “I followed my plan / I broke my plan.”
- Track R-multiples (not dollars) to measure consistency.
Over 30 trades, this is how you build real confidence.
How signals fit into a trading plan (without dependency)
Signals work best when they plug into your routine.
You still manage risk, execution, and psychology.
If you want structured entries with clear SL/TP, explore United Kings signals and our dedicated Gold signals flow for London/NY setups.
10) XAUUSD vs Major Forex Pairs: What to Trade and When
Many traders ask: should I focus on gold or majors like EUR/USD and GBP/USD?
The answer depends on your temperament, schedule, and risk tolerance.
Gold can pay faster, but it can also punish faster.
Majors can be smoother, but sometimes they’re slow and choppy.
Comparison table: XAUUSD vs EUR/USD vs GBP/USD vs USD/JPY
| Market | Typical Personality | Volatility (relative) | Best Sessions | Common Beginner Mistake | Best Use Case |
|---|---|---|---|---|---|
| XAUUSD (Gold) | Fast impulses, sharp reversals | High | London + New York overlap | Oversizing and tight stops | Intraday momentum + macro hedging |
| EUR/USD | More technical, smoother trends | Medium | London, NY | Trading mid-range chop | Trend/range strategies with cleaner structure |
| GBP/USD | Spiky, can trend hard | Medium-High | London, NY | Entering before confirmation | Breakouts and pullbacks with room |
| USD/JPY | Yield-driven, can be relentless | Medium | Asia + NY | Ignoring intervention risk | Macro trend following with risk controls |
How to choose your “main” instrument
- If you like action and can manage risk tightly: gold fits.
- If you prefer slower, more technical movement: EUR/USD fits.
- If you like volatility but want forex structure: GBP/USD fits.
- If you understand yields and macro trends: USD/JPY fits.
Many profitable traders specialize in one instrument first.
Then they add a second later.
If you want both, United Kings covers gold and majors through Forex signals and gold-specific execution guidance.
11) Common XAUUSD Mistakes (and the Fixes That Actually Work)
Gold doesn’t need to “trick” you.
Most losses come from repeatable behavior mistakes.
Fix the behavior, and your strategy suddenly “works.”
Mistake #1: Trading gold like EUR/USD
EUR/USD might respect a 10–15 pip stop on M15 in calm markets.
Gold often won’t respect a $6 stop during London.
Fix: size down and widen stops to structure ($10–$25), then target 1:2+.
Mistake #2: Chasing breakouts late
Gold breaks $2658, runs to $2666, and you buy.
Then it pulls back to $2658 and stops you.
Fix: wait for break-and-retest or enter earlier with defined invalidation.
Mistake #3: Moving stop loss “to avoid being wrong”
This is how small losses become account damage.
Fix: accept the loss as a business expense.
Gold rewards discipline more than intelligence.
Mistake #4: Trading every news candle
News candles are designed to create emotional decisions.
Fix: either sit out high-impact releases or trade them with a specific plan and reduced risk.
For volatility playbooks, see how to trade XAUUSD during FOMC/CPI volatility.
Mistake #5: No journal, no feedback loop
If you don’t track your behavior, you can’t improve it.
Fix: journal 20 trades with screenshots and R-multiples.
Your edge will show up faster than you think.
12) How United Kings Helps You Trade XAUUSD with Structure (Signals + Education)
Learning how to trade gold is one thing.
Executing it consistently—especially during London/NY volatility—is another.
This is where a professional signal framework and community can compress your learning curve.
What “premium signals” should look like
A real signal is not “buy now” with no context.
A professional-grade signal includes:
- Entry (exact price or zone).
- Stop loss (clear invalidation).
- Take profits (TP1/TP2/TP3).
- Trade idea (why this setup exists).
- Session context (London/NY timing).
That’s the standard we aim for at United Kings.
United Kings value props (what you get)
- Premium Telegram signals for forex and gold with clear Entry/SL/TP.
- 85%+ win-rate target framework through strict selection and risk rules (no guarantees; results vary).
- 300K+ active traders in the community—so you’re not trading alone.
- London and New York session focus where liquidity is best.
- Educational content alongside signals so you build skill, not dependency.
- 48-hour money-back guarantee for peace of mind.
How to start (simple path)
- Read 2–3 related guides in our blog to align with our framework.
- Join the signal stream that matches your focus: Gold signals or Forex signals.
- Pick a plan on our pricing page (Starter 3 Months $299, Best Value 1 Year $599 with FREE ebook, or Lifetime $999).
- Execute on demo for 1–2 weeks if you’re new, then go live with small risk.
- Join our Telegram community at United Kings Telegram channel for real-time updates.
Where to learn more about us
If you want the story behind the team and the mission, visit About United Kings.
If you have questions about plans or access, contact us via United Kings support.
FAQ: XAUUSD Trading Guide (Gold Trading Questions)
1) Is XAUUSD good for beginners?
Yes, but only if you reduce risk and trade fewer sessions.
Start with 0.5% risk per trade, use $10–$25 structure-based stops, and avoid overtrading.
2) What is the best timeframe to trade gold?
Many traders map zones on H4/H1 and execute on M15/M5.
Beginners often do best with M15 entries because it reduces noise.
3) How much should my stop loss be on XAUUSD?
There’s no single number, but a common intraday range is $10–$25 from entry, based on structure and volatility.
Then target at least 1:2 risk-reward.
4) Why does gold spike and reverse during news?
Because liquidity thins, spreads widen, and large orders hit the market at once.
Stops get swept, then price finds the true direction after the first wave of orders is absorbed.
5) Do I need to watch DXY and USD/JPY to trade XAUUSD?
You don’t “need” to, but it helps.
DXY and USD/JPY can act as filters to avoid low-probability trades when USD strength or yields are dominating the tape.
Risk Disclaimer (Read Before You Trade)
Trading forex and gold (XAUUSD) involves significant risk and is not suitable for all investors. You can lose some or all of your capital. Past performance does not guarantee future results. Signals and educational content are provided for informational purposes only and do not constitute financial advice. If you are a beginner, we strongly recommend practicing on a demo account first and using strict risk management on every trade.
Final Word: If You Want to Trade Gold Like a Pro, Trade It With a System
Gold at $2650 is not “too high” or “too scary.”
It’s simply a market that demands structure: session timing, clean levels, correlation awareness, and disciplined risk.
If you want to shortcut the trial-and-error and trade with a community that focuses on London and New York execution, join United Kings.
Get started with our premium Gold signals, explore all options on United Kings pricing (3 Months $299, 1 Year $599 Best Value + FREE ebook, Lifetime $999), and join the live stream on United Kings Telegram.
Your next step: choose one setup type, risk small, and execute consistently—then let compounding do what hype never will.