
You place a stop loss, price moves close, then your trade closes at a loss — even though your chart looks like it never touched the stop. This is one of the most common (and most frustrating) execution issues for new and experienced traders.
The usual culprit is stop loss hit spread: your stop triggers on the broker’s bid/ask price, not on the single line you’re staring at. Add spread widening during news or rollover, different broker price feeds, and occasional slippage, and the mystery makes sense.
Key takeaways
- Stops trigger on Bid or Ask depending on whether you’re in a buy or sell — your chart may only display one side.
- Spread widening can “reach” your stop even if the candlestick wick never does.
- Different brokers can show different highs/lows (feed/liquidity differences), so your stop can be valid on the broker’s data.
- Slippage can fill you beyond the stop price in fast markets; the stop level is a trigger, not a guaranteed fill.
- You can usually verify the reason using a simple checklist: bid/ask view, spread at the time, tick data, and execution logs.
What you’re seeing vs what your broker executes
Most chart confusion comes from one assumption: “the price” is a single number. In reality, there are always two prices:
- Bid: the price you can sell at (where sell orders execute).
- Ask: the price you can buy at (where buy orders execute).
The difference between them is the spread. Your platform may plot candles using Bid only, Ask only, or a mid-price depending on settings and broker. But your stop loss is triggered by the side that can actually close your position.
Which price triggers your stop loss?
This is the rule that explains most “it never hit my stop” complaints:
- If you are in a BUY, your stop loss is a sell order to close. It triggers on the Bid.
- If you are in a SELL, your stop loss is a buy order to close. It triggers on the Ask.
So if you’re short and your chart is mostly showing Bid candles, Ask can spike to your stop while the Bid wick stays below it. Visually, it looks like your stop was “skipped,” but execution-wise it was correct.
Stop loss hit spread: the most common explanation
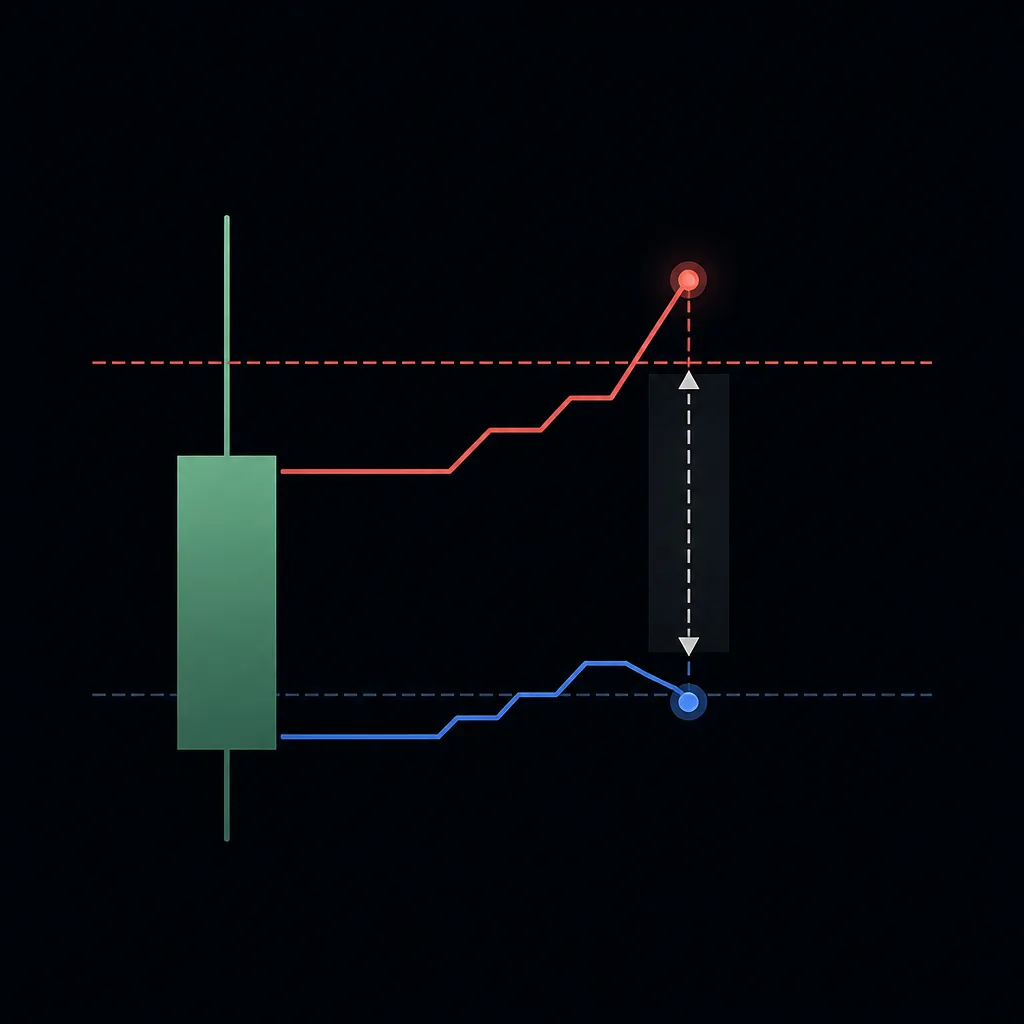
Let’s make it concrete with a hypothetical example. (Numbers below are for method only, not a forecast.)
Hypothetical example: short trade stopped out without the wick touching
Example: You sell XAUUSD at 2,400.0 with a stop loss at 2,410.0 (10.0 dollars risk). Your platform candles are based on Bid.
- Bid trades up to 2,409.6 (wick high), so on the chart it looks safe.
- But at that moment the spread widens and the Ask prints 2,410.1.
- Your stop on a short triggers on Ask, so the stop is hit even though the visible wick (Bid) never touched 2,410.0.
That’s a classic bid ask spread stop loss issue. Nothing “illegal” has to happen for this to occur—just normal two-sided pricing.
Why it happens more on gold (XAUUSD) and volatile pairs
XAUUSD often has:
- Wider average spreads than major FX pairs (especially outside liquid hours).
- Faster spikes around macro news and session opens.
- More frequent spread widening at rollover.
If you’re newer to gold, start with the basics in gold trading for beginners and make sure you understand how XAUUSD is quoted in what is xauusd.
Spread widening stop loss: when the market “breathes” and your stop is too close
Spreads are not fixed. Even if your broker advertises “low spreads,” they can widen during specific conditions:
- High-impact news (CPI, NFP, central bank decisions)
- Rollover / end-of-day liquidity drop (often around the daily swap time)
- Session transitions (late NY to Asia can be thin)
- Sudden volatility spikes (risk-off headlines, large market orders)
When spreads widen, your stop can be hit even though the “main” price line doesn’t appear to reach it. This is especially noticeable on sell trades (Ask spikes) and on platforms that only plot Bid candles.
Hypothetical example: spread widening at rollover
Example: You buy EURUSD with a stop 12 pips away. During normal liquidity the spread is 1 pip. Around rollover, spread widens to 6 pips for a short period.
- Bid dips 8 pips against you (chart looks fine).
- But the widened spread means Ask/Bid relationship shifts; the Bid (which triggers a BUY stop) can print low enough to hit your stop.
This is not the broker “hunting” you by default; it can simply be the cost of trading through thin liquidity.
Broker feed differences: your chart isn’t the only chart

Another common reason your stop triggers “without touching” is that you’re comparing the stop to a different price feed than the one that executed your trade.
Price is decentralized in spot FX and broker CFDs. Different brokers can have:
- Different liquidity providers
- Different spread markups
- Slightly different tick histories
- Different server time / candle close times
That means the high/low wick on Broker A’s 1-minute candle can differ from Broker B’s. If your stop was on Broker A, the only “truth” that matters is Broker A’s bid/ask ticks at that moment.
Quick reality check
If you’re looking at TradingView (or a friend’s chart) and saying “price never hit it,” you might be looking at a different feed. The stop can still be valid on your broker’s feed.
Slippage: your stop is a trigger, not a guaranteed fill
Even when price genuinely trades through your stop, you might be filled at a worse price. That’s slippage.
Two key points:
- A stop loss becomes a market order when triggered (in most retail setups).
- In fast markets, the next available price might be beyond your stop level.
Hypothetical example: stop triggers at 2,410.0 but fills at 2,412.2
Example: You are short XAUUSD with stop at 2,410.0. A fast spike happens; the next tradable Ask after your stop triggers is 2,412.2. Your trade closes there.
On your chart, it can look like the wick barely touched 2,410.0 (or even didn’t, depending on candle construction), yet your fill is worse. That’s not the same as spread widening—this is execution during a fast move.
Platform display issues: what you see may be simplified
Sometimes the stop was hit cleanly, but your platform view hides the evidence.
Common display causes
- You’re viewing a higher timeframe (e.g., M15/H1). The candle may not show the exact tick path; it only shows OHLC.
- You’re not displaying Ask line. You only see Bid candles, but your stop triggers on Ask (for sell positions).
- Chart scaling makes it look like the wick didn’t touch (zoom in; check exact values).
- Indicators/overlays can visually obscure the exact wick tip.
If you want to reduce surprises, trade during more liquid windows. For gold, see best time to trade xauusd.
One table that clears up most confusion
| Situation | What you see on the chart | What actually triggers the stop | Most likely cause | What to check |
|---|---|---|---|---|
| SELL trade stopped out, wick looks short | Bid wick high stays below your SL | Stop triggers on Ask for SELL positions | Ask touched SL due to spread | Enable Ask line / check spread at the time |
| BUY trade stopped out, wick looks short | Chart shows Ask candles or mid-price | Stop triggers on Bid for BUY positions | Bid dipped to SL even if Ask didn’t | Confirm which price your candles use |
| Stop hit around news | Fast spike, weird candle, big wick | Stop triggers normally, but fill can slip | Spread widening + slippage | Execution price vs stop price; timestamps |
| Stop hit around rollover | Price “barely moved,” then stopped | Temporary spread expansion reaches SL | Thin liquidity / spread widening | Spread history; avoid holding tight stops through rollover |
| Stop hit but other broker chart never touched | Different high/low elsewhere | Your broker’s ticks are the reference | Broker feed differences | Compare your broker’s tick data, not TradingView |
Step-by-step: how to verify why your stop loss was hit
When this happens, don’t guess. Run a quick investigation so you know whether it was spread, slippage, or a display/feed mismatch.
Step 1) Identify your position type and trigger price
- If it was a BUY, the stop triggers on Bid.
- If it was a SELL, the stop triggers on Ask.
Write that down first. Many traders troubleshoot the wrong price line.
Step 2) Pull the exact stop level and close time from your history
- Stop loss level (e.g., 2,410.0)
- Close price (the fill)
- Time the order closed (to the minute/second if available)
We need the timestamp because spread and volatility conditions change quickly.
Step 3) Check whether your chart is showing Bid, Ask, or mid
On many platforms you can enable an Ask line (or show both prices). If you can’t, open a quote panel that shows live Bid/Ask and watch how they differ.
If you were stopped on a SELL, and you were only looking at Bid candles, you’ve already found a likely explanation.
Step 4) Zoom into a lower timeframe around the stop-out
If you were looking at M15 or H1, drop to M1 and zoom in around the stop-out time. Higher timeframes compress detail and can hide brief spikes.
Step 5) Check spread at the stop-out moment
You’re looking for evidence of spread widening stop loss:
- Was there major news at that time?
- Was it near rollover?
- Was it during a thin session?
If your platform provides tick charts or spread history, use them. If not, the next best thing is comparing the close time to known liquidity events (news/rollover).
Step 6) Compare stop level vs fill price to detect slippage
- If the fill is very close to your stop, it’s likely spread/trigger mechanics.
- If the fill is meaningfully worse than your stop, slippage probably played a role.
Slippage is more common when price moves fast and liquidity is thin.
Step 7) Confirm you’re not comparing to a different feed
If you checked TradingView or another broker and the wick didn’t touch, that doesn’t invalidate your stop-out. The only relevant data is the broker that executed your trade.
Step 8) Document it (so you don’t repeat it)
Save a screenshot with:
- Bid/Ask visible if possible
- Your SL line
- The stop-out timestamp
- Any news/rollover notes
After 10–20 trades, patterns become obvious (for example: “my tight stops get clipped at rollover” or “news spreads are killing my scalps”).
How to reduce stop-outs caused by spread and execution
You can’t remove spread from trading. But you can stop letting it surprise you.
1) Place stops with spread in mind (especially for SELL trades)
If you sell, your stop triggers on Ask. That means the market only needs an Ask print at your SL, not a Bid wick.
Practical approach: if you normally use very tight stops, consider adding a small buffer during known spread-risk periods. The right buffer depends on the instrument and time of day.
If you want a structured way to size risk while allowing more realistic stops, build it into your plan using forex risk management and calculate your lot size accordingly with a lot size calculator.
2) Avoid holding tight stops through rollover and thin liquidity
If your strategy requires very tight stops, avoid the times when spreads commonly widen. If you must hold, consider whether your stop distance actually matches the market conditions.
3) Be careful trading right into major news
During high-impact releases, both spread widening and slippage can increase. If you trade news, do it intentionally with rules. If you don’t trade news, don’t “accidentally” be in the market with a tight stop during news.
4) Use limit entries where appropriate (to control entry price)
Limit orders can reduce entry slippage, but they don’t eliminate stop-loss mechanics. Your stop can still be hit by spread widening. This is about controlling one part of execution, not all of it.
5) Match your strategy to the instrument
Gold can be less forgiving to ultra-tight stops during certain hours. If you’re building a rules-based approach, see our broader xauusd trading strategy guide for structure and context.
6) Don’t confuse “stop hunt” stories with basic microstructure
Sometimes price really does spike into obvious liquidity. But most “my stop was hunted” complaints are just traders not accounting for:
- Bid vs ask triggering
- Spread widening
- Different feeds
- Slippage during volatility
If you fix those first, your post-trade analysis becomes much clearer.
Quick checklist: was it spread, slippage, or display?
- Was it a BUY or SELL? (BUY stops trigger on Bid; SELL stops trigger on Ask.)
- Was Ask visible? If you were short and only saw Bid candles, spread is a prime suspect.
- Did it happen during news or rollover? If yes, spread widening is likely.
- Was the fill worse than the stop level? If materially worse, slippage likely contributed.
- Are you comparing to a different broker/chart feed? If yes, ignore the other wick—check your broker’s data.
- Did you check a lower timeframe/ticks? A brief spike may not be obvious on higher timeframes.
FAQ
Why did my stop loss get hit when the candle didn’t touch it?
Because the stop may trigger on a different price than the candle you’re viewing. Many charts show Bid candles, but a SELL stop triggers on Ask. If Ask reached your stop due to spread, the trade closes even if the Bid wick didn’t touch.
Does a stop loss always execute at my stop price?
No. A stop is typically a trigger that sends a market order. In fast markets you can get slippage and be filled at a worse price than the stop level.
Is spread widening normal or is my broker manipulating prices?
Spread widening can be normal during thin liquidity (rollover), high-impact news, or sudden volatility. To evaluate fairness, compare your broker’s spread behavior across multiple days and avoid judging by a single event.
Why is this more common on XAUUSD?
Gold often has wider spreads than major FX pairs and can move quickly around news and session transitions. That combination makes it easier for the bid/ask spread to reach stops that look “safe” on a single price line.
What should I do after a suspicious stop-out?
Record the stop level, fill price, and timestamp. Then check bid/ask visibility, spread at that time, and whether news/rollover was happening. If your platform provides tick data, verify whether Bid or Ask touched the stop based on your trade direction.
Risk warning: Trading forex and gold (XAUUSD) involves a significant risk of loss and is not suitable for every investor. Spreads can widen, slippage can occur, and losses can exceed expectations, especially during volatile periods. Past performance does not guarantee future results. This article is for education only and is not personal financial advice. If you’re unsure, practise on a demo account before trading live.
If you prefer to follow structured trade ideas with clear levels, United Kings sends forex and gold signals on Telegram with an entry, stop loss, and take-profit levels. You can see a selection in our free telegram channel, and review how results are tracked on our results and methodology pages. If you want access to the VIP plans, details are on our pricing page.


